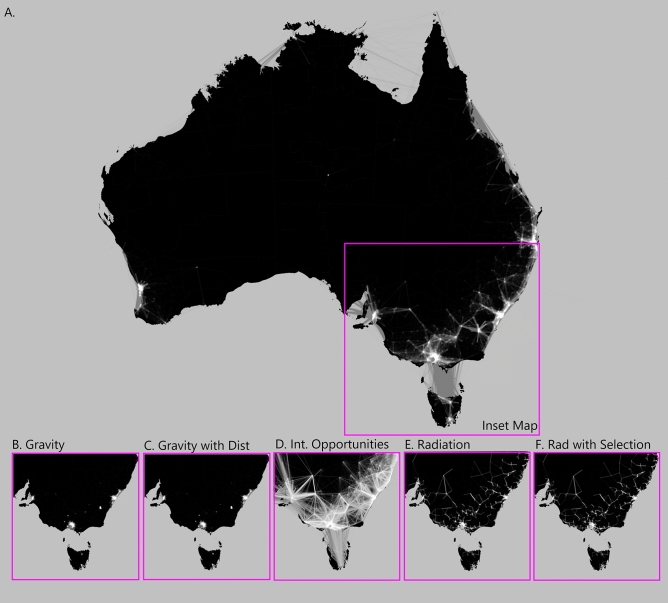
Figure 4.
Ensemble model predictions for Australia using ABS census data (A). Inset maps for gravity (B), gravity with distance (C), intervening opportunities (D), radiation (E) and radiation with selection (F) models respectively all trained using ABS data. Movement predictions from each model were scaled to be between 0 and 1 to aid visual comparison. Vivid thick white lines represent high intensity movement, whilst faint thin darker lines represent low intensity movement. The maps in this figure were produced using the R33 package ggplot234 (see Visualisation of predictions section in Methods for further detail). Preview35 and Paint 3D36 were used to combine the maps into one image, overlay the squares and add the text.

