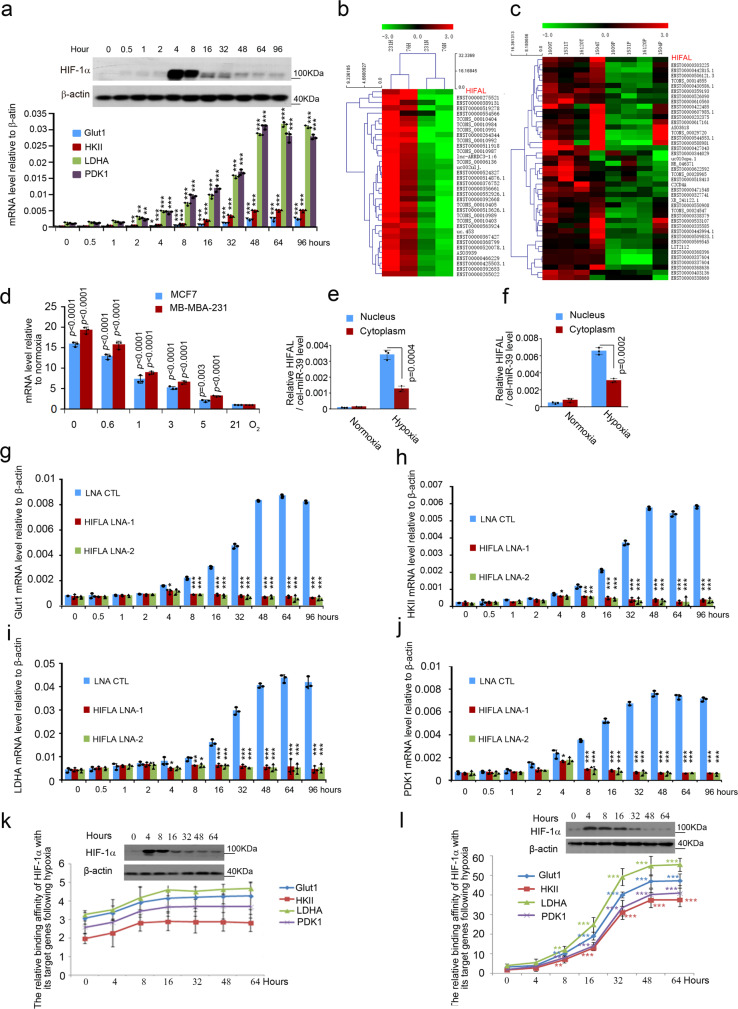
Fig. 1. LncRNA HIFAL is essential for maintaining HIF-1α triggered transcription under hypoxia.
a The kinetics of HIF-1α protein level under hypoxia, determined by immunoblotting, was not parallel with that of its target gene transcription by qRT-PCR in MDA-MB-231 cells. p = 0.0055, p = 0.0062, p = 0.0038 at 2 h of HKII, LDHA, PDK1; p = 0.0219 at 4 h of GLUT1; p < 0.0001 at 8h-96h of GLUT1, HKII, LDHA, PDK1. b Hierarchical clustering for the lncRNAs differentially expressed in MDA-MB-231 and 76 N cells, cultured under normoxia (20%) or hypoxia (0.6%) conditions (fold change > 10, p < 0.05, two-sided paired t-test). c Microarray analysis of lncRNA expression in 4 pairs of breast cancer and adjacent normal tissues. (p < 0.05, two-sided paired t-test). d HIFAL level increases upon hypoxia, as measured by qRT-PCR. e, f HIFAL translocates into the nucleus upon hypoxia. The relative level of HIFAL in cytoplasmic and nuclear extract of MCF-7 (e) and MDA-MB-231 (f) cells were detected by qRT-PCR. Exogenous cel-miR-39 was added into the cytoplasmic or nuclear-fractionated RNA as an independent control. g–j After knocking down HIFAL, the kinetics of HIF-1α protein level under hypoxia was parallel with that of its target gene transcription. QRT-PCR was used to examine the mRNA expression of indicated genes GLUT1 (g), HKII (h), LDHA (i), PDK1 (j) in MDA-MB-231 cells (CTL vs LNA1 p = 0.015, p = 0.03, p = 0.04, p = 0.038, respectively, at 4 h in g, h, i, j. CTLvsLNA2 p = 0.02 at 4 h in g. CTLvsLNA1, p < 0.0001, p = 0.0012, p = 0.0062, p < 0.0001; CTLvs LNA2, p < 0.0001, p = 0.0011, p = 0.0159, p = 0.0002 at 8 h in g, h, i, j. CTLvsLNA1, CTLvsLNA2, p < 0.0001at 16h-96h in g, h, i, j. The HIFAL levels in cells are shown in the upper panel of (g). k, l Binding kinetics of HIF-1α to its target genes keeps increasing after hypoxia, which is dependent on HIFAL. The HIF-1α ChIP experiments were performed in the HIFAL KO (k) or WT MDA-MB-231 cells (l) at indicated time points after hypoxia and normalized by the corresponding HIF-1a protein levels. P = 0.0027, p = 0.0092, p = 0.0025, p = 0.0032 at 8 h, p < 0.0001 at 16h-64h of GLUT1, HKII, LDHA, PDK1. For a, d–l, p values were determined by two-sided unpaired t-test. Graphs show means ± SD of experimental triplicates. ***p < 0.001, **p < 0.01, *p < 0.05. Source data are provided as a Source Data file.

