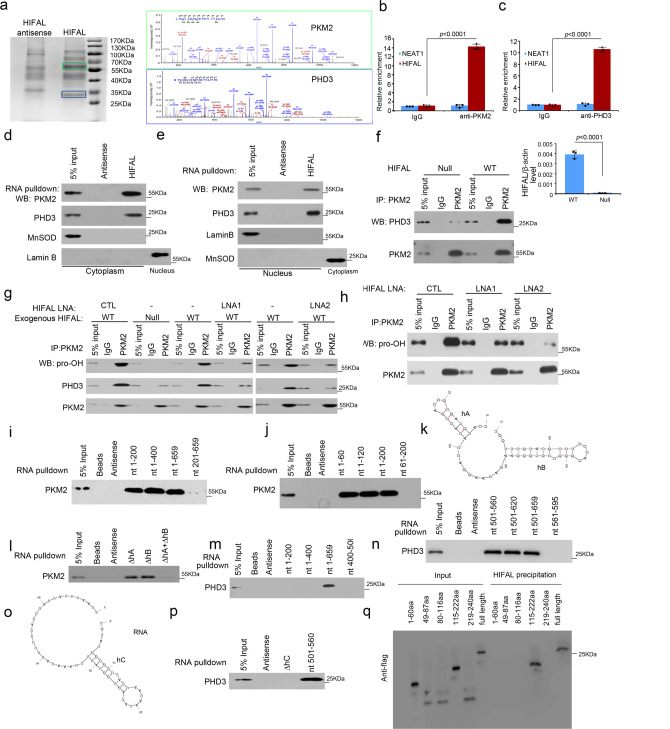
Fig. 2. HIFAL promotes the binding of PKM2 to PHD3 and enhances hydroxylation of PKM2 by PHD3.
a PKM2 and PHD3 were identified as HIFAL binding proteins under hypoxia. The bands in frames, which were specifically precipitated by HIFAL, were submitted for mass spectrometry. The antisense of HIFAL was used as the negative control. b, c RNA immunoprecipitation assay shows the binding of PKM2 or PHD3 with HIFAL under hypoxia. QRT-PCR was used to detect the RNA level of HIFAL or Neat1in the precipitates. d, e HIFAL binds to PKM2 and PHD3 in both cytoplasm and nucleus. f Enforced HIFAL expression increases the binding of PKM2 with PHD3. HIFAL plasmid was transiently transfected into HIFAL null MDA-MB-231 cells (right panel shows the relative HIFAL level) for 48 h, and then cultured under hypoxia. g, h HIFAL-LNA reduces the hydroxylation of PKM2 and the binding of PKM2 with PHD3. The HIFAL null MDA-MB-231 cells were transfected with WT HIFAL and treated with HIFAL-LNAs and then cultured under hypoxia (g). Knockdown of endogenous HIFAL reduces PKM2 hydroxylation (h). i–k RNA pulldown using sequentially deleted HIFAL fragments shows the binding region of HIFAL with PKM2. nt 1–200 (i) and 1–60 (j) fragments contain the binding region of HIFAL with PKM2. (k) The structure of HIFAL fragment (nt 1–60) predicted by Mfold and RNAfold. l Double deletion of hA and hB (ΔhA + ΔhB) abolishes the binding of HIFAL fragment (nt 1–60) with PKM2. m–o RNA pulldown using sequentially deleted HIFAL fragments shows the binding region of HIFAL with PHD3. nt 501–659 (m) and 501–560 (n) fragments contain the binding region of HIFAL with PHD3. (o) The structure of HIFAL fragment (nt 501–560) predicted by Mfold and RNAfold. p Deletion of hairpin c (ΔhC) abolishes the binding of HIFAL fragment (nt 501–560) with PHD3. q The truncated PHD3 mutant harboring 115–222aa retains the binding ability with HIFAL. Full length or the PHD3 fragments was transfected into HEK293 cells for HIFAL RNA-pull down assay. For b, c, f, bar graphs represent means ± SD of experimental triplicates, and p values were determined by two-sided unpaired t-test. Source data are provided as a Source Data file.

