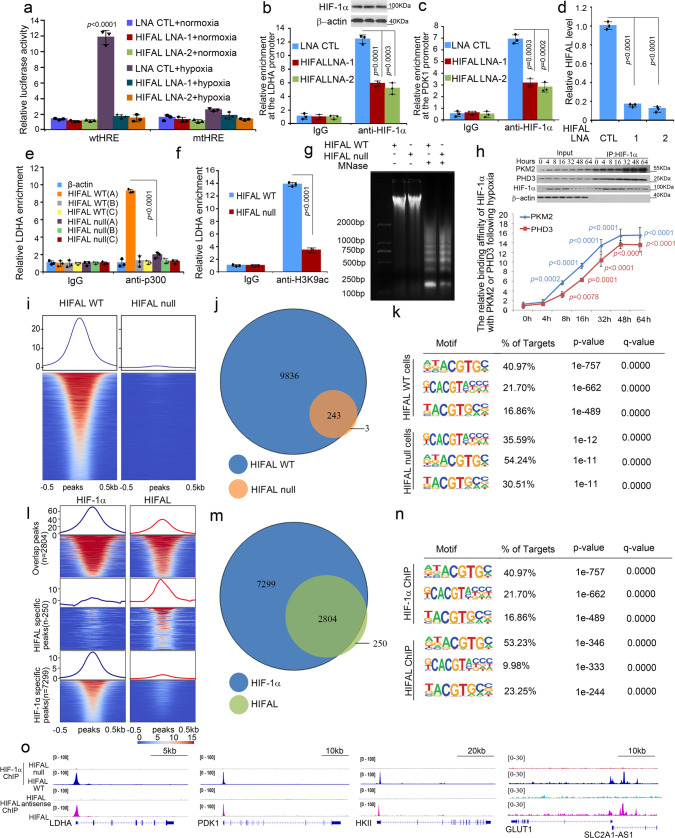
Fig. 6. HIFAL is essential for the HIF-1α transcription activities.
a The HRE element transcription activity is inhibited by HIFAL-LNA upon hypoxia. b–d HIFAL knockdown decreases the binding of HIF-1α to the promoter of LDHA (b) and PDK1 (c). HIFAL levels are shown in (d). e, f HIFAL knockout decreases the binding of p300 to the promoter of LDHA (e) and the histone H3K9 acetylation on the LDHA promoter (f). Primers spanning the LDHA locus [LDHA(A)], −873~−697bp[LDHA(B)] and +631~+823 bp[(LDHA(C)] were used. g HIFAL knockout decreases the chromatin sensitivity to micrococcal nuclease. h, The binding kinetics of HIF-1α to PKM2 and PHD3 keeps increasing after hypoxia in the presence of HIFAL. HIF-1α co-immunoprecipitation (Co-IP) assay was performed at indicated time points after hypoxia and normalized to the corresponding HIF-1a protein levels. i Distribution profiles of HIF-1α binding genes flanking the transcription start sites (TSS) in HIFAL WT or null MDA-MB-231 cells under hypoxia as determined by ChIP-seq. The 10 kb regions centered on all the TSSs of HIF-1α binding genes were shown. Red indicates enrichment, while blue indicates no enrichment. j, HIF-1α cannot bind to most of its target genes in the HIFAL null condition. k Binding motifs enriched within 1 kb of the promoter region. l A dual heatmap illustrating the co-occupancy peaks of HIF1a and HIFAL ChIP-seq in MBA-MD-231 cells. Peaks were rank from the highest amount of HIF-1α/HIFAL to the lowest, and were flanking with ±0.5 kb sequence of TSS. Red indicates enrichment, while blue indicates no enrichment. m The enrichment peaks of HIFAL and HIF-1α overlap significantly. Under the most stringent criteria, 2804 out of the 3054 (91.8%) HIFAL peaks are also bound by HIF-1α. n Binding motifs enriched within ±0.5 kb of the promoter region. HIF-1α and HIFAL shares the most frequent target sequence. o Representative HIF-1α target glycolysis gene loci are similarly enriched by both HIF-1α and HIFAL in HIFAL WT or null MDA-MB-231 cells. Graphs show means ± SD of experimental triplicates, p values were determined by two-sided unpaired t-test (a–f, h). Source data are provided as a Source Data file.

