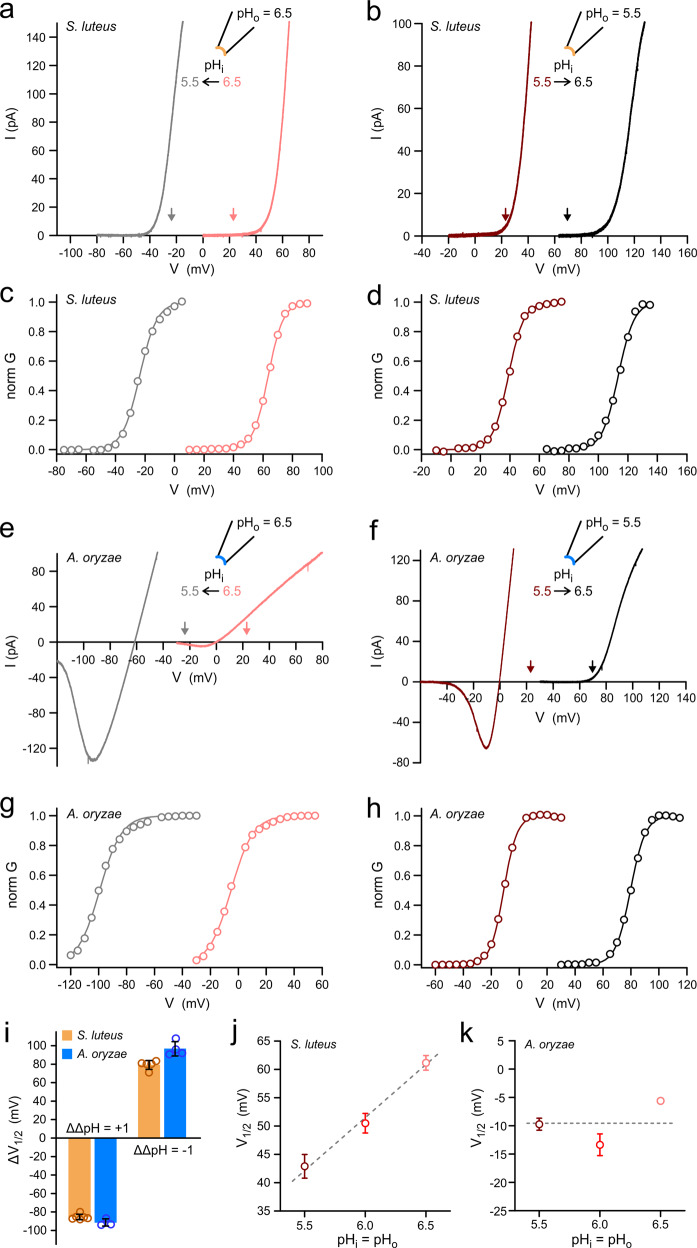
Fig. 3. Gating of fungal Hv1s is strongly ΔpH dependent.
a Change in I–V relationship for SlHv1 in response to change in ΔpH from 0 to 1. b Change in I–V relationship for SlHv1 in response to change in ΔpH from 0 to −1. Currents in a and b were measured at the indicated ΔpH in inside-out patches. Voltage was changed using ramp protocols described in “Methods”. Arrows represent the voltages at which the SlHv1 should start conducting measurable current (Vthreshold) if the channel followed the general behavior of animal Hv1 channels (see main text), with shifts around 40 mV per pH unit. The colors of the arrows reflect the corresponding ΔpH conditions. c, d G–V relationships derived from I–V curves in (a) and (b), respectively (see “Methods”). e, f same as (a) and (b) but for AoHv1. g, h G–V relationships derived from I–V curves in (e) and (f), respectively. i Average shifts in V1/2 as a function of change in ΔpH (ΔΔpH) measured from G–Vs, like the ones shown in (c, d) and (g, h). Each bar represents the mean of 3–7 independent measurements ± SEM. j V1/2 of G–Vs from SlHv1 as a function of pH under symmetrical conditions (ΔpH = 0). Each point represents the mean of 5–6 independent measurements. Error bars are SEM. Dashed line is the linear fit of the data with slope = 19 ± 2 mV/pH unit. k Same as (j) but for AoHv1. Each point represents the mean of 3–4 independent measurements. Error bars (SEM) are not shown where smaller than symbols. Data are consistent with insensitivity to pH when ΔpH = 0, shown as dashed line.

