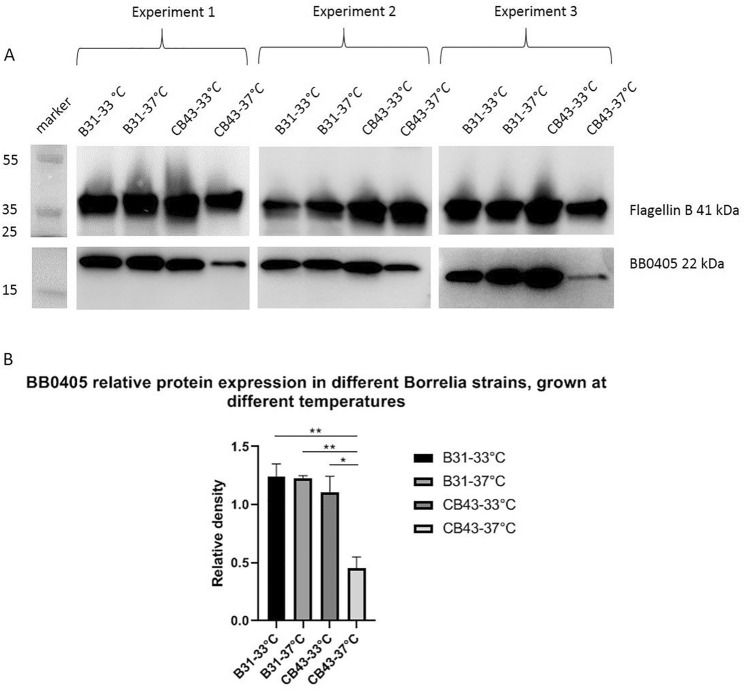
Figure 4.
(A) Western blot showing expression of BB0405 in different B. burgdorferi sl strains (Borrelia burgdorferi strain B31 and Borrelia afzelii strain CB43) grown at different temperatures. A temperature of 33 °C, resembling (feeding) tick conditions, and 37 °C, resembling conditions in the mammalian host, was used to culture the spirochetes. Lysates of the in vitro cultured spirochetes were obtained, as described in the materials and method section, and subjected to Western blot. Three independent experiments were performed. The first experiment is displayed on the left, the second experiment in the middle and the third experiment is displayed on the right. The far left lane is the protein weight marker. Blots were loaded with 2.5 ug/well whole lysates of spirochetes and were cut in half just between the bands of Flagellin B (41 kDa) and BB0405 (22 kDa) to enable separate incubations. The blots displayed at the top are incubated with anti-flagellin rabbit IgG 1:1000 (as a loading control) and subsequently with secondary antibody anti-rabbit IgG-HRP 1:1000. Blots displayed at the bottom are incubated with pooled serum from mice vaccinated with recombinant BB0405 1:500 and subsequently with secondary antibody anti-mouse IgG-HRP 1:2000, respectively. Blot images were cropped (Image acquisition tools Microsoft Powerpoint). Imaging was performed using ImageQuant LAS 4000 and quantification using Image J (Wayne Rasband, National Institutes of Health, USA, Java 1.8.0_77(32-bit), http://imagej.nih.gov/ij). Full length blots are presented in Supplementary Fig. S1–S6. (B) Protein expression of BB0405 as determined by Western blot in panel A was quantified and normalized against the relative density of loading control Flagellin B. Relative density was determined using ImageJ software (National Institute of Health). A quantitative comparison between samples on the same blot and within the same experiment were made. Statistical differences between groups were calculated using an unpaired parametric t-test. Error bars represent mean ± s.e.m. n.s.: P > 0.05.

