Figure 1.
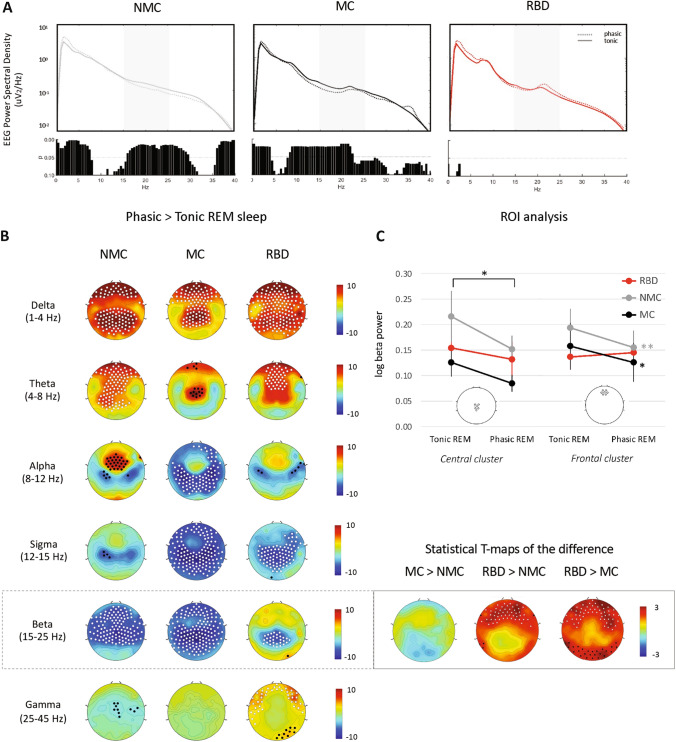
Spectral differences between phasic and tonic REM in RBD patients and controls. (A) Global EEG power spectra in phasic (dotted light) and tonic (continuous line) REM in the three groups. FDR-corrected p values from paired t-tests for the comparison between states within groups are shown below each plot, respectively. Greyed areas represent the beta band. (B) Normalized change in log power between phasic and tonic REM sleep across indicated frequency bands (delta: 1–4 Hz; theta: 4–8 Hz; alpha: 8–12 Hz; sigma: 12–15 Hz; beta: 15–25 Hz; and gamma: 25–40 Hz) for non-medicated controls (left column), medicated controls (middle column) and RBD patients (right column). White dots indicate p < 0.05 and black dots p < 0.1 after SNPM correction for one-sample t-test between both REM sleep sub-stages. Statistics on the changes showed significant differences between groups in the beta range only and are shown in the right insert. Individual channel t-maps are represented, with white dots indicating channels with SNPM corrected p < 0.05 and black dots uncorrected p < 0.05 after unpaired t-tests on the phasic to tonic REM power difference. (C) ROI analysis for central and frontal changes in absolute beta power between tonic and phasic REM sleep. Central and frontal ROIs were centered around Fz and Cz respectively and consisted of six and seven electrodes each (see inserts). Repeated-measure ANOVA with “group” and “REM sub-stage” on the log power revealed for the central cluster: a significant effect of REM sub-stage only (p < 0.01); for the frontal cluster: a significant effect of REM sub-stage (p < 0.01) and a trend for an interaction “group” × “REM sub-stage” (p = 0.056). * and ** for p < 0.05 and p < 0.01 Tukey Kramer post-hoc test between “tonic” and “phasic”.

