Figure 2.
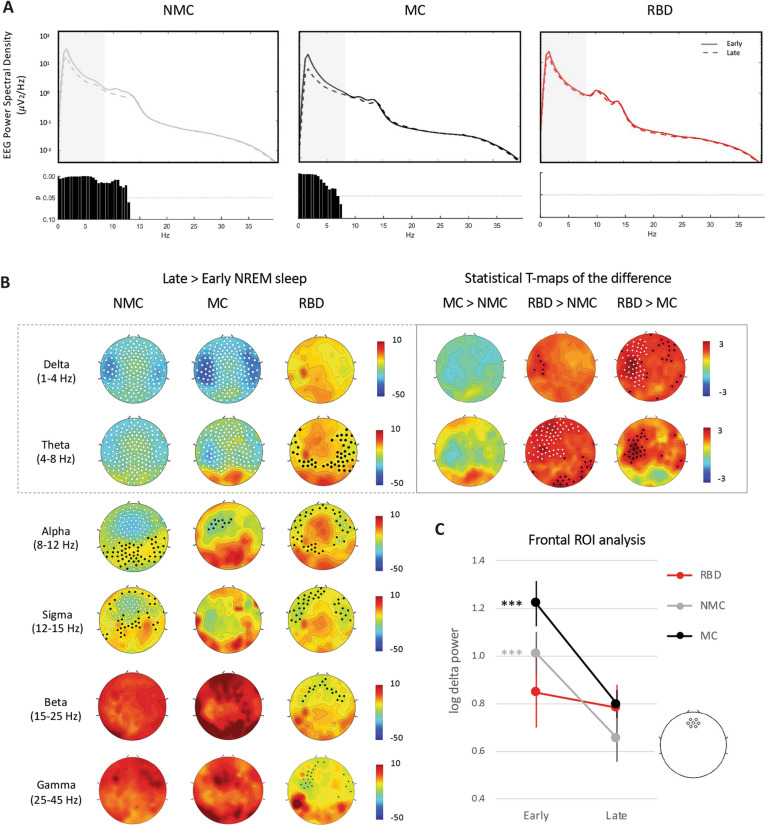
Delta and theta power as NREM sleep homeostasis markers in RBD patients and controls. (A) Global EEG power spectra in NREM sleep from the first cycle (continuous line) and last cycle (dashed line) in the three groups. FDR-corrected P values from paired t-tests for the comparison between states within groups are shown below each plot, respectively. Greyed areas represent the delta/SWA and theta band. (B) Normalized change in log power between the last and first cycle of NREM sleep in delta/SWA (1–4 Hz) and theta (4–8 Hz) in non-medicated controls (left), medicated controls (middle) and patients (right). Left columns: White dots indicate p < 0.05 and black dots p < 0.1 after SNPM correction for one sample t-test on the change. Statistics on the changes showed significant differences between groups in the delta and theta range only and are shown in the right insert. Individual channel t-maps are represented, with white dots indicating channels with SNPM corrected p < 0.05 and black dots uncorrected p < 0.05 after unpaired t-tests on the late to early NREM power difference. (C) ROI analysis for change in frontal absolute delta power/SWA between early and late night. Frontal ROI was centered around Fz and consisted of seven electrodes (see insert). The expected decrease in absolute delta power/SWA is visible in both control groups but not in patients. Repeated-measure ANOVA with “group” and “time” revealed a significant interaction (p = 0.012). *** p < 0.001 Tukey Kramer post-hoc test between “early” and “late”. The frontal delta power during the first cycle in RBD patients appeared lower compared to medicated controls at a trend level (p = 0.06).

