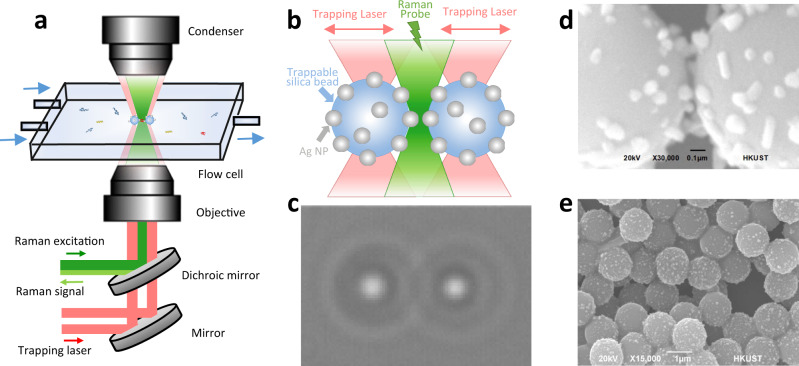
Fig. 1. Illustration of the controllable SERS probe experiments.
a Schematic diagram of the optical tweezers-coupled Raman spectroscopic platform with microfluidic set-up. b Two trapping laser beams (red) to manipulate two AgNP-coated beads and one Raman probe beam (green) to detect signals from the gap between the two AgNP-coated beads. c The real-time camera image of two trapped AgNP-coated beads from the microscope. d SEM image of the gap between two AgNP-coated beads. The scale bar is 0.1 μm. e SEM image of AgNP-coated beads to show the uniform AgNP coating. The scale bar is 1 μm. All micrographs are representative images of three independent measurements.

