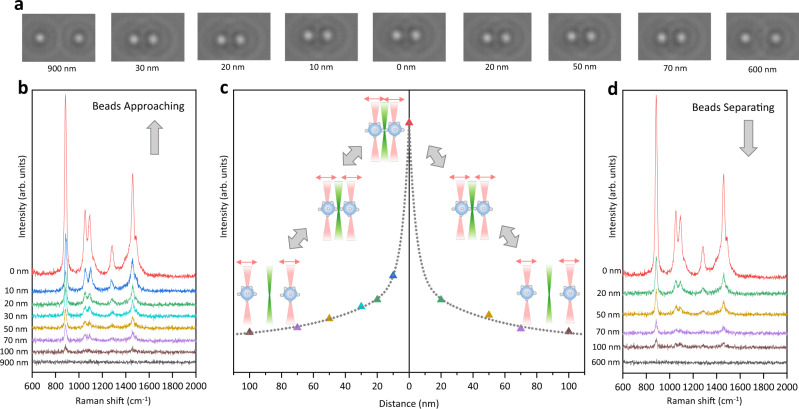
Fig. 2. Creation and adjustment of the dynamic hotspot with in situ SERS measurements of 1% ethanol aqueous solution.
a The real-time camera images of the two AgNP-coated beads trapped at different distance. b SERS spectra of 1% ethanol aqueous solution with 1 s acquisition time when the two AgNP-coated beads approaching. c The intensity of the ethanol characteristic peak at 1458 cm−1 as a function of the distance between the two AgNP-coated beads from beads approaching to beads separating. The reversible bead positions are illustrated as inset. d SERS spectra of 1% ethanol aqueous solution with 1 s acquisition time when the two AgNP-coated beads separating. Source data are provided as a Source data file.

