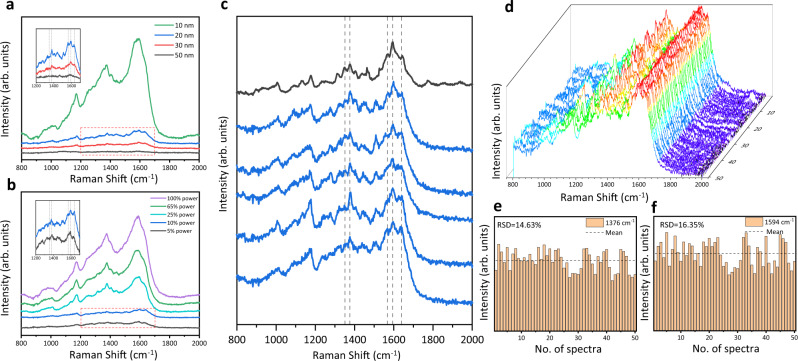
Fig. 3. The spectroscopic characterizations of hemoglobin at its native states.
a SERS spectra of 100 nM hemoglobin in aqueous solution when the two AgNP-coated beads were trapped at different distance (50–10 nm). b SERS spectra of 100 nM hemoglobin solution under different Raman excitation power (5–100%). c The comparison between SERS spectra of 100 nM hemoglobin solution with 1 s acquisition time (blue) and the spontaneous Raman spectrum of 250 μM hemoglobin solution with 60 s acquisition time (black). d 3D stacking plot of SERS spectra of 100 nM hemoglobin solution obtained from AgNP-coated beads trapped at 20 nm with 1 s acquisition time. e, f The histograms of the intensities of the hemoglobin characteristic peaks at 1376 cm−1 (mean = 4929.15 in arb. units, RSD = 14.63%) and 1594 cm−1 (mean = 5391.41 in arb. units, RSD = 16.35%) across the 50 SERS spectra in (d), respectively. Source data are provided as a Source data file.

