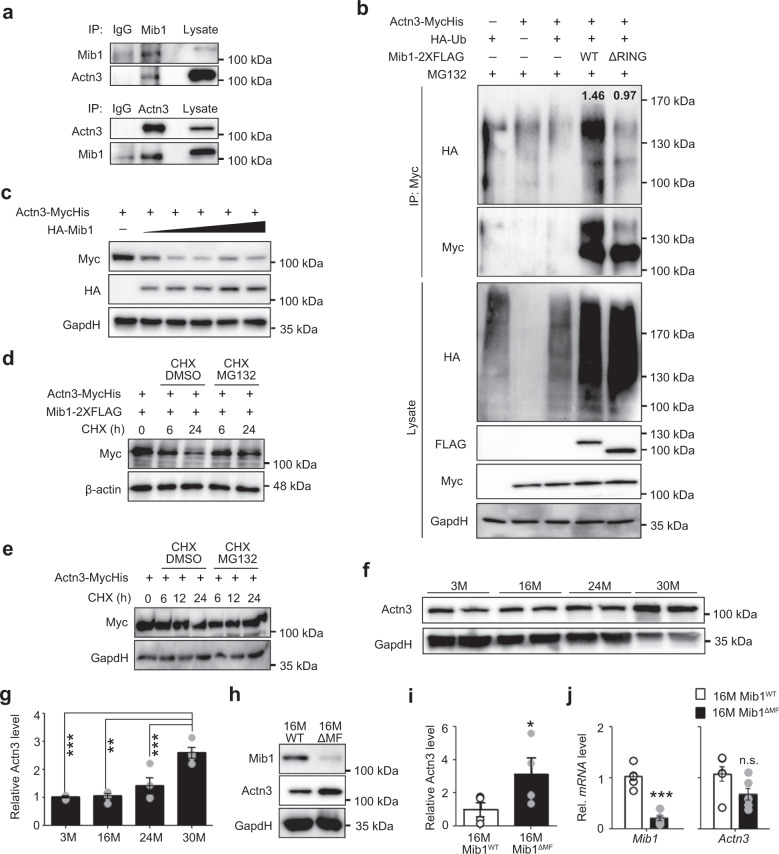
Fig. 4. Regulation of Actn3 via Mib1-mediated proteasomal degradation pathway in skeletal muscles.
a Endogenous interaction of Mib1 and α-Actn3 (Actn3) in GA muscle lysates. GA muscle lysates from 3-month-old WT mice were subjected to endogenous IP using anti-Mib1 and Actn3 antibody. Mouse and rabbit IgG were used as a nonspecific control. b IB analysis of ubiquitination and proteasomal degradation of Actn3 in 293T cells. The 293T cells were transfected with indicated plasmids and treated with 10 μM MG-132 for 6 h. Whole lysates were subjected to IP using anti-Myc, followed by IB analysis. The intensities of HA (Ub) protein of lanes 4 and 5 were 1.46 ± 0.12 and 0.97 ± 0.07, respectively (p = 0.03). c IB analysis of Mib1-dependent Actn3 protein levels. The 293T cells were transfected with 4 μg of MycHis-tagged Actn3 and 0.5, 2, 4, 8, and 16 μg of HA-tagged Mib1. d, e IB analysis of Actn3 protein degradation in 293T cells with (d) or without (e) Mib1-2× FLAG. 293T cells were transfected with MycHis-tagged Actn3 and/or HA-tagged Mib1 followed by treatment with cycloheximide (CHX) and MG-132 or 0.1% DMSO for the indicated times. f, g IB analysis (f) and the intensity (g) of Actn3 expression in GA muscles of WT mice with indicated ages. h, i IB analysis (h) and the intensity (i) of Mib1 and Actn3 expression in GA muscles of 16-month-old Mib1WT and Mib1ΔMF mice (p = 0.019 for i). j Mib1 and Actn3 mRNA levels in GA muscles (p = 2.06E−05 for Mib1 and 0.0519 for Actn3). The intensity of protein expression of IB was quantified by densitometry. Data are shown as representatives of at least three independent experiments. Data are presented as means ± s.e.m. n = 4 (f, g), n = 6 (h–j) mice per genotypes. One-way ANOVA for (g). Two-tailed Student’s t test for (i, j). *P < 0.05; **p < 0.01; ***p < 0.001; n.s. not significant.

