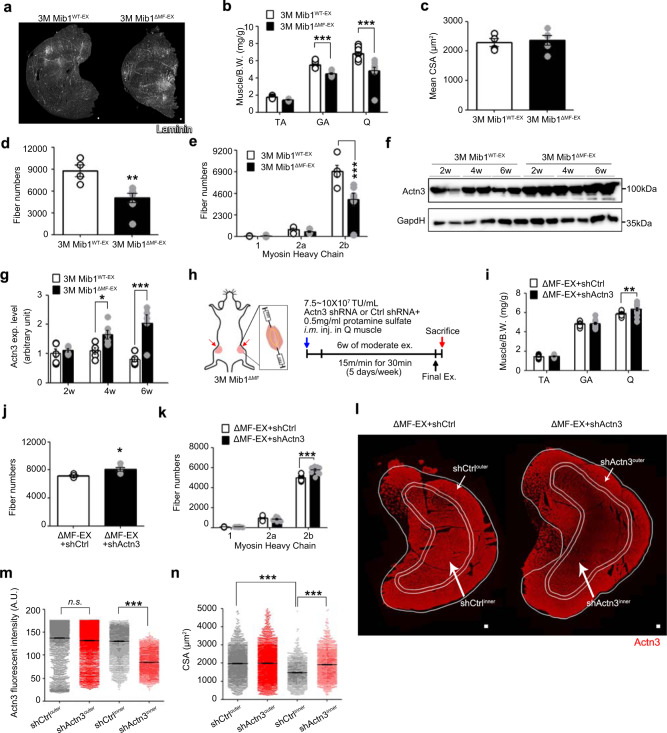
Fig. 5. Induction or amelioration of chronic exercise-induced muscle atrophy of young Mib1ΔMF mice.
a Representative images of IHC staining for laminin (white). b Relative hindlimb muscles to body weights. c Mean CSA of Q muscles. d, e Quantification of whole myofiber numbers (d) and myofiber numbers by fiber types (e) (p = 0.0063 for d). f, g IB analysis of Actn3 from insoluble muscle lysates from GA muscles of exercised Mib1WT (Mib1WT-EX) and exercised Mib1ΔMF (Mib1ΔMF-EX) mice (f) and intensity of Actn3 (g) at indicated times. h Three-month-old Mib1ΔMF were i.m. injected with lentiviral shRNAs targeting control shRNA (shCtrl, hereafter ΔMF-EX + shCtrl) or Actn3 (shActn3, hereafter ΔMF-EX + shActn3) to both sides of Q muscles. The local injection of shRNA into Q muscle is shown in yellow dotted line. A week later, mice were subjected to chronic exercise. i Relative hindlimb muscles to body weights. j, k Quantification of whole myofiber numbers (j) and myofiber numbers by fiber types (k) (p = 0.0039 for j). l Representative images of IHC staining for Actn3. The IHC images were taken simultaneously with the same light setting, exposure time, and magnification. Actn3 intensity within shActn3-injected Q muscle was divided into high (outer part; area between single and double line) and low (inner part; surrounded by double line). Corresponding outer and inner parts were shown in shCtrl-injected Q muscles. m Actn3 fluorescent intensity of outer and inner part of ΔMF-EX + shCtrl and ΔMF-EX + shActn3. Note that Actn3 intensity of inner part of ΔMF-EX + shActn3 (ΔMF-EX + shActn3inner) is significantly lower than corresponding inner part of ΔMF-EX + shCtrl (ΔMF-EX + shCtrlinner). n CSA of outer and inner part of ΔMF-EX + shCtrl and ΔMF-EX + shActn3. Note that mean CSA of shActn3inner is larger than corresponding part of shCtrlinner. Please note that CSA of outer part of skeletal muscle is generally larger than inner part. Scale bars, 100 μm (a) and 125 μm (l). The intensity of protein expression of IB was quantified by densitometry. Data are presented as means ± s.e.m. Data are shown as representatives of at least three independent experiments. n = 6 and 5 for Mib1WT and Mib1ΔMF mice, respectively (b). n = 4 and 5 for Mib1WT and Mib1ΔMF mice, respectively (c, d, e, g, j). n = 8 and 7 for Mib1WT and Mib1ΔMF mice, respectively (i, k). n = 3169, 3749, 2662, and 2827 myofibers for shCtrlouter, shActn3outer, shCtrlinner, and shActn3inner, respectively (m). n = 2218, 2624, 1597, and 1696 myofibers for shCtrlouter, shActn3outer, shCtrlinner, and shActn3inner, respectively (n). One-way ANOVA for (m, n). Two-way ANOVA for (b, e, g, i, k). Two-tailed Student’s t test for (c, d, j). *P < 0.05; **p < 0.01; ***p < 0.001.

