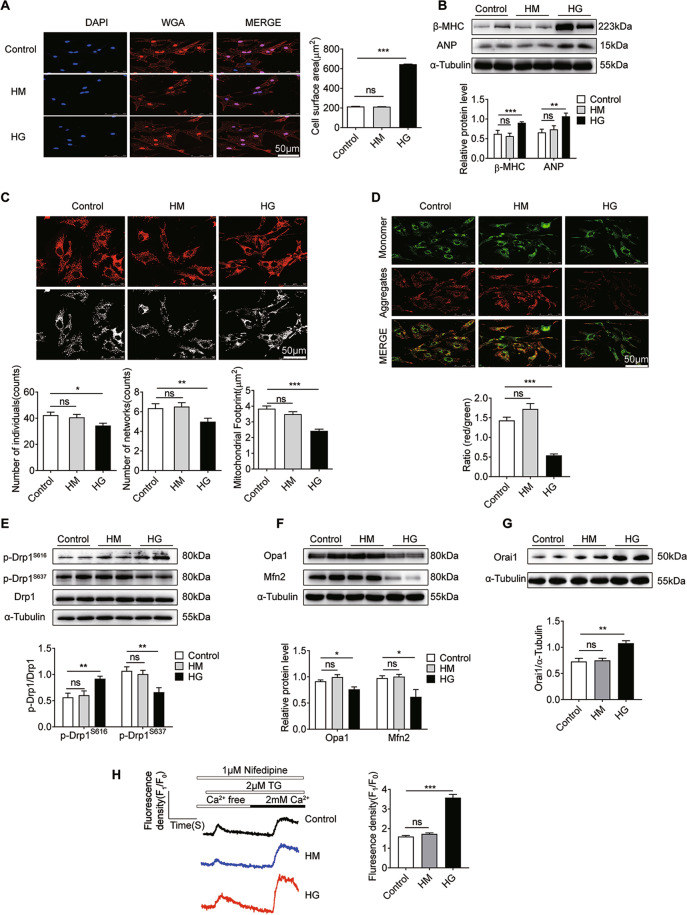
Fig. 3. HG induces cardiomyocyte hypertrophy with abnormalities in mitochondrial dynamics and calcium handling.
A WGA staining (red) of the surface membrane of cardiomyocytes, and DAPI staining (blue) of nuclei. Scale bars = 50 μm. To quantify cardiomyocyte size, HG induced an increase in cardiomyocyte size (n = 45 cells). B Western blotting images and summarized data showing β-MHC (n = 5) and ANP (n = 11) levels in NRCMs. C Confocal images of mitochondrial morphology in NRCMs. RGB color, scale bars = 50 μm; 8-bit color, scale bars = 3 μm. There was a main effect of HG on the number of individuals and networks, and the size of the mitochondrial footprint. Overall, HG decreased all mitochondrial network parameters (n = 140 cells). D JC-1 staining of NRCMs. Red fluorescence is from JC-1 aggregates in healthy mitochondria with polarized inner mitochondrial membranes, while green fluorescence is emitted by cytosolic JC-1 monomers and indicates MMP dissipation. Merged images indicate the co-localization of JC-1 aggregates and monomers. Scale bar = 50 μm. MMP of cardiomyocytes for each group was calculated as the fluorescence ratio of red to green. HG decreased the MMP (n = 390 cells). E Western blotting images and summarized data showing Drp1 protein level and phosphorylation at S616 (n = 6) or S637 (n = 8) in NRCMs. F Western blotting images and summarized data showing Opa1 (n = 4) and Mfn2 (n = 3) protein levels in NRCMs. G Western blotting images and summarized data showing Orai1 protein levels in NRCMs (n = 4). H Representative traces of Ca2+ influx in NRCMs are shown. Fluorescence intensity measurements of Fluo4-AM revealed the intracellular Ca2+ concentration in NRCMs following CaCl2 stimulation (n = 76 cells). F1 fluorescence intensity, F0 baseline fluorescence. Data are shown as mean ± SEM. *P < 0.05, **P < 0.01, and ***P < 0.001; n.s. no significant statistical difference.

