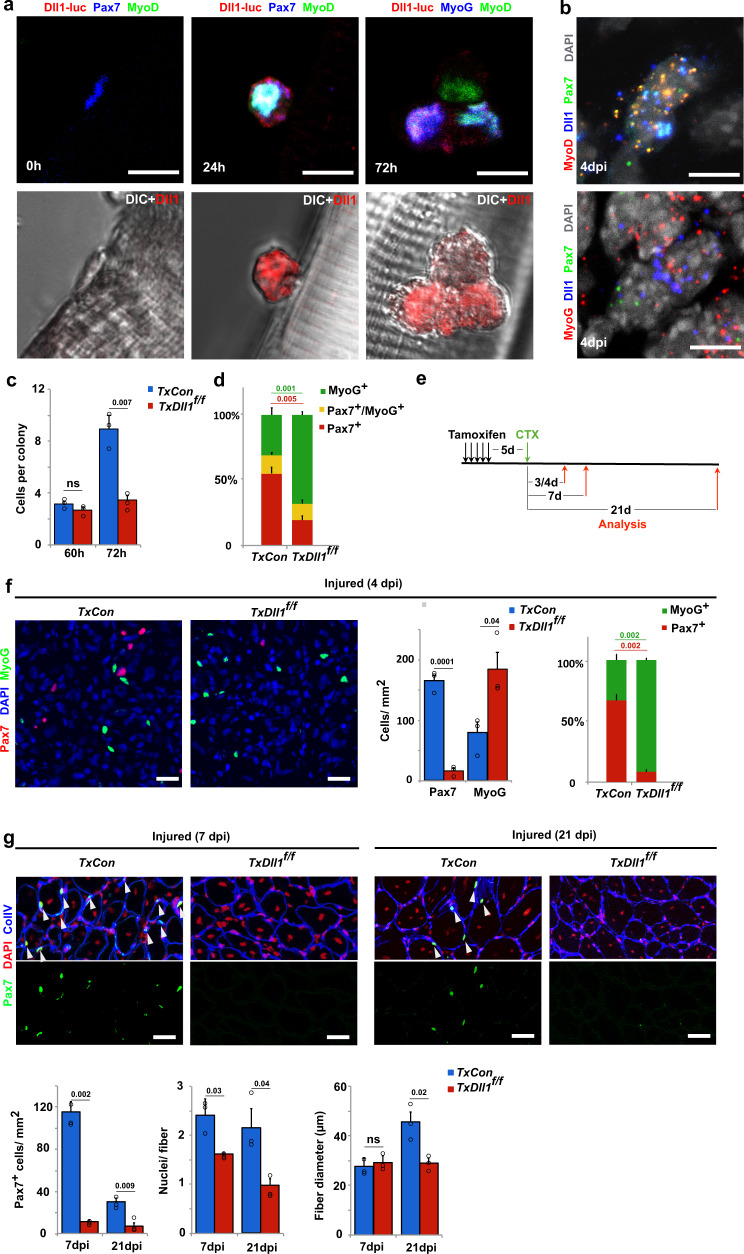
Fig. 1. Dll1 expressed by activated and differentiating muscle stem cells controls the maintenance of the stem cell pool.
a Upper panels: Immunofluorescence analysis of muscle stem cells associated with fibers from mice carrying the Dll1luc allele; myofibers were freshly isolated (0 h), or cultured for 24 and 72 h as indicated. Lower Panels: corresponding differential interference contrast (DIC) images. Dll1-Luc (anti-luciferase; red), Pax7 or MyoG (blue), MyoD (green); n = 4 animals. b RNAscope analysis of a regenerating tibialis anterior (TA) muscle at 4 days post injury (dpi); MyoD or MyoG (red), Dll1 (blue), Pax7 (green); DAPI was used as counter stain (white); n = 5 animals. c Quantification of colony size of muscle stem cells on fibers from control (TxCon; blue bars) and Dll1 mutant (TxDll1f/f; red bars) animals; fibers were cultured for 60 and 72 h. n = 3 animals. d Quantification of cells that express Pax7 (red bars), Pax7 and MyoG (yellow bars), MyoG (green bars) in colonies associated with myofibers from control (TxCon) and Dll1 null mutant (TxDll1f/f) animals cultured for 72 h; n = 3 animals. e Schematic outline of the regeneration experiment shown in f,g. The Dll1 null mutation was induced by tamoxifen (TxDll1f/f mutant mice); black arrows: tamoxifen injections; green arrow: cardiotoxin (CTX) treatment; red arrows: analysis of muscle regeneration. f Immunohistological analysis of cells expressing Pax7 (red) and MyoG (green) in the injured muscle of control (TxCon) and Dll1 null mutant (TxDll1f/f) animals at 4dpi (left panels). Quantifications of Pax7+ and MyoG+ cells (right panels). Quantified were the numbers of Pax7+ or MyoG+ cells/mm2 in TxCon (blue bars) and TxDll1f/f (red bars) animals, which is also displayed as the proportion of Pax7 + (red) and MyoG + (green) cells (n = 3 animals). g Immunohistological analysis of cells expressing Pax7 (green), Collagen IV (ColIV, blue) in the injured muscle of control (TxCon) and Dll1 null mutant (TxDll1f/f) animals at 7dpi (left) and 21 dpi (right); DAPI (red) is used as counterstain. Quantifications of Pax7+ cells/mm2, nuclei/fiber and fiber diameter are shown below (TxCon, blue bars and TxDll1f/f, red bars); n = 3 animals. Scale bars, 10 μm (a, b) and 50 μm (f,g). Data are presented as mean values ± SEM. Exact p values are indicated, unpaired two-sided t-test.

