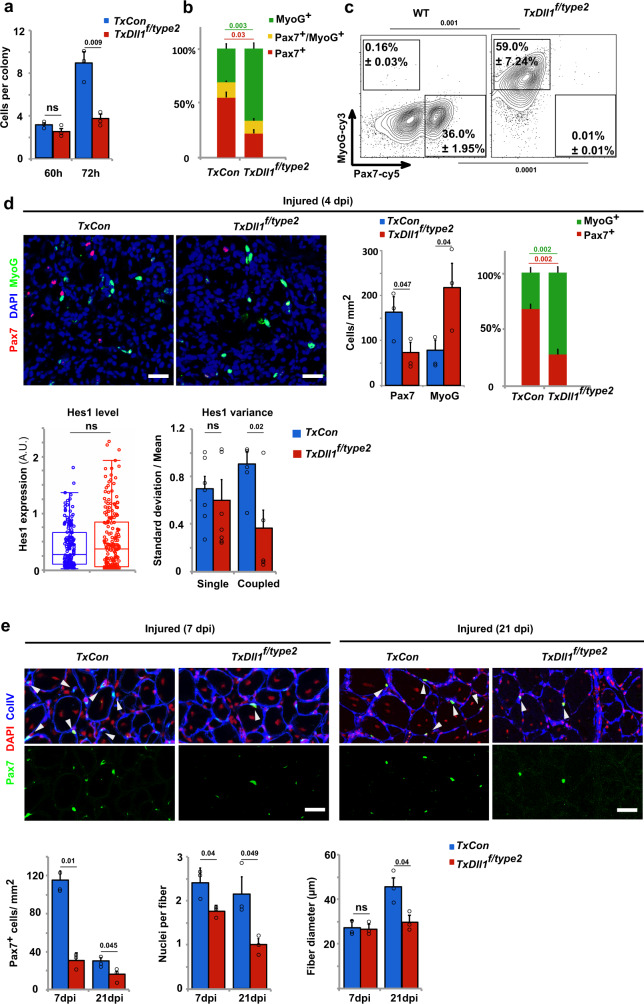
Fig. 7. Oscillatory Dll1 expression controls muscle regeneration.
a Quantification of the number of cells in colonies formed on myofibers; myofibers were isolated from TxCon (blue bars) and TxDll1f/type2 mice (red bars) and cultured for 60 and 72 h; n = 3 animals. b Quantification of cells that express MyoG+ only (green), MyoG+ and Pax7+ (yellow), and Pax7+ only (red) in colonies associated with myofibers after 72 h of culture; fibers were isolated from TxCon and TxDll1f/type2 mice; n = 3 experiments. c Gating strategy and representative FACS plot used to define MyoG+ (MyoG-cy3) and Pax7+ (Pax7-cy5) cells in cultured spheres containing wild-type (WT) and Dll1type2 mutant cells; n = 3 experiments. d Immunohistological analysis of the regenerating muscle of TxCon and TxDll1f/type2 mutant mice at 4 dpi using anti-Pax7 (red) and anti-MyoG (green) antibodies; DAPI (blue) was used as counterstain (upper left). Quantifications of the number of Pax7+ and MyoG+ cells in TxCon (blue bars) and TxDll1f/type2 (red bars) muscle, and relative proportion of MyoG+ (green) and Pax7+ (red) cells in TxCon and TxDll1f/type2 muscle (upper right); quantification of Hes1 expression levels in Pax7+ cells and variance of Hes1 protein levels in single and coupled Pax7+ cells of the regenerating muscle (4 dpi) of TxCon (blue bars) and TxDll1f/type2 (red bars) animals (lower panels); n = 3 animals. e Immunofluorescence analysis of TxCon and TxDll1f/type2 mutant mice at 7 and 21 dpi using anti-Pax7 (green) and anti-collagen IV (ColIV; blue) antibodies; DAPI (red) was used as counterstain (upper panels). Quantification of the number of Pax7+ cells, number of nuclei/fiber and fiber diameter in the regenerating muscle of TxCon (blue bars) and TxDll1f/type2 (red bars) mice at 7 and 21 dpi (lower panels); n = 3 animals. Scale bars, 50 μm. Data are presented as mean values ± SEM. Exact p values are indicated, ns indicates P > 0.05, unpaired two-sided t-test.

