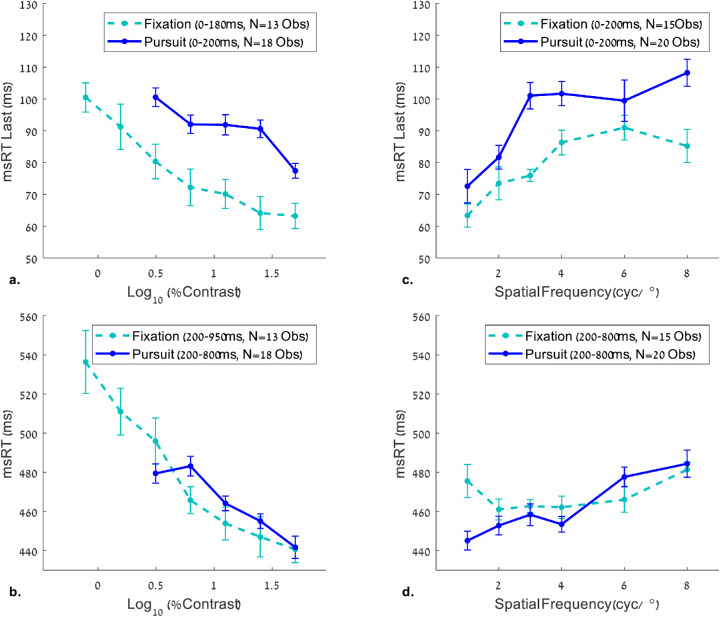
Figure 10.
Comparison between OMI measures for static fixation and smooth pursuit. The msRT values were plotted in the early (a, c) and late (b, d) windows for contrast (a, b) and spatial frequency (c, d) measurements. The data for the effect of contrast during fixation (a, b) were obtained from Bonneh et al. (2015). Note the longer microsaccade RT for the pursuit, compared to static fixation in the inhibition onset windows (a, c), but not in the inhibition release windows (b, d). The reliability of this comparison is limited by a few small differences between the current study and that of Bonneh et al. (2015), including Gabor size (twice as small in our study) and the time windows used for msRT extraction (a small difference; see the legend).

