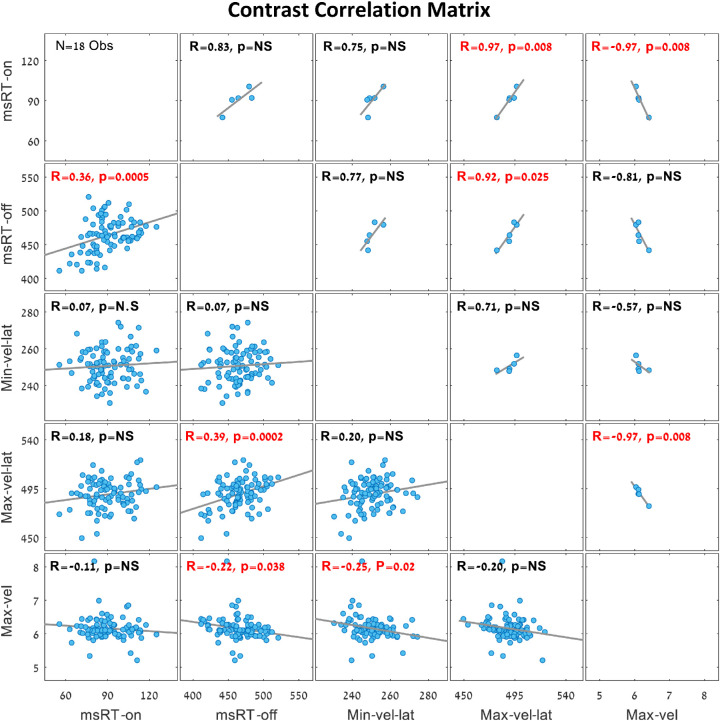
Figure 7.
Correlation matrix of OMI measures during smooth pursuit in the contrast trials (N = 18 observers with five contrast levels). The plots above the diagonal show the group average for each contrast (five dots, one for each contrast) and the plots below the diagonal show the correlations of individual observers (one dot per observer and contrast). Significant correlation values are denoted in red. Note the significant linear correlations in the inhibition release window between msRT (200-800 ms) and the maximum velocity latency (300-700 ms), with R = 0.92 for the group average and R = 0.39 for the individual observers’ data. This represents an increase in latency, along with a decrease in stimulus visibility in both OMI measures. When correcting for multiple comparisons (10), some correlations become insignificant, but the combined picture is clear.

