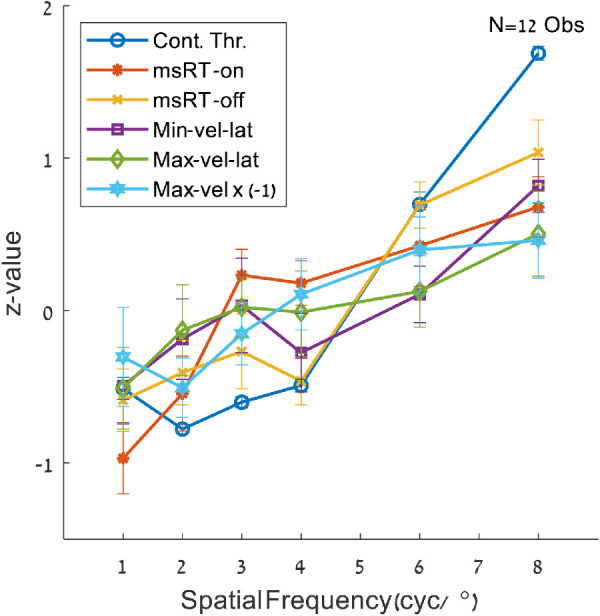
Figure 8.

Contrast detection thresholds and oculomotor measures. The data were obtained from the spatial frequency and contrast sensitivity (psychophysics) experiments, for the spatial frequencies of 1, 2, 3, 4, 6, and 8 cyc/°; they were converted to Z-values per observers by subtracting the mean and dividing by the standard deviation. Note the similar trend for all displayed parameters. The maximum velocity values are multiplied by −1 to point out the trend.
