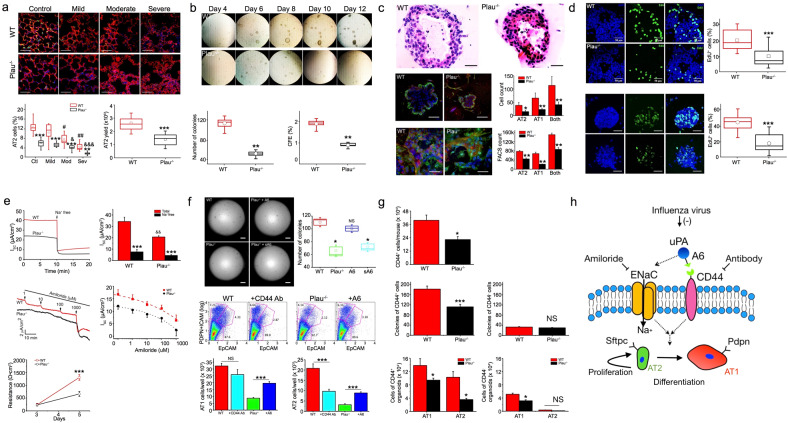
Fig. 1.
a Quantification of AT2 cells in influenza-infected mouse lungs 5 days post infection. n = 10 sections from 3 different mice per group. Yield of AT2 cells from Plau−/− and wt control mice. (n = 15 mice/genotype). b Colony formation observed and analyzed from day 4 to day 12 post seeding. Colony number and colony forming efficiency (CFE) on day 8 of the cultures. (n = 16 wells per set of experiments and repeated with 6 pairs of mice). c Representative images of organoid sections stained with the H & E procedure for wt and Plau−/− group. Stacked confocal images of wt and Plau−/− organoids. AT1 and AT2 cells were identified and counted as pdpn-positive (red) and sftpc-positive (green) cells, respectively (n = 16 organoids per group from three separate experiments). Confocal images and FACS analysis of polarized AT2 monolayers (n = 19 transwells per group from three separate experiments). d A Click-iT EdU assay kit was used to identify AT2 cells with active DNA synthesis on day 7 of the monolayer cultures (n = 16 per group from 6 separate preparations). Stacked organoid images of DAPI for nuclei (left), EdU (middle), and merged (right) in wt and Plau−/− organoids (n = 25 for each group from 6 separate preparations). e Representative short-circuit current (Isc) in the presence and absence of bath Na+ ions. The bath solution was replaced with Na+ free medium as indicated by arrows, summarized Isc level, Isc traces in the presence of accumulating amiloride added to the apical compartment, dotted and dashed lines are generated by fitting raw data points with the Hill equation to compute IC50 value for amiloride (130 ± 2.5 μM for wt and 108 ± 14.9 μM for Plau−/− cells), transepithelial resistance of AT2 monolayers measured with a chopstick meter (n = 15 monolayers from 3 different cell preparations). f Effects of the A6 peptide and CD44 receptor on the formation of organoids and AT2 lineage in organoids. (n = 16 transwells/group from 6 independent experiments). Colony number on day 8 of the cultures. (n = 16 wells per set of experiments and repeated with 6 pairs of mice). FlowJo analyzed FACS results. Wt AT2 cells were treated with blocking antibody against CD44 receptor, and Plau−/− cells were incubated with A6 peptide. Pdpn and EpCAM are biomarkers for AT1 and AT2 cells, respectively. (n = 12 transwells for each group from 6 independent experiments). g Comparison of the number of EpCAM+CD44+ AT2 cells between wt and Plau−/− mice. n = 7 mice/genotype. Number of organoids per transwell for CD44+ and CD44− AT2 cells. n = 18 for each group from four independent experiments. Statistical comparison of FACS data for AT1 and AT2 cells in organoids grown from CD44+ and CD44– subpopulations. n = 12 transwells per group from three independent experiments. h Summary of the uPA-A6-CD44+-ENaC cascade in regulating the fate of AT2 cells critical for re-alveologenesis. Scale bar, 50 and 100 µm. Data are means ± sem and analyzed with the Student’s t test, pair signed rank test, and one-way ANOVA followed by Tukey post hoc analysis in NS, not significant, *P ≤ 0.05, **P ≤ 0.01, and ***P ≤ 0.001 compared with wt controls

