
Fig. 2.
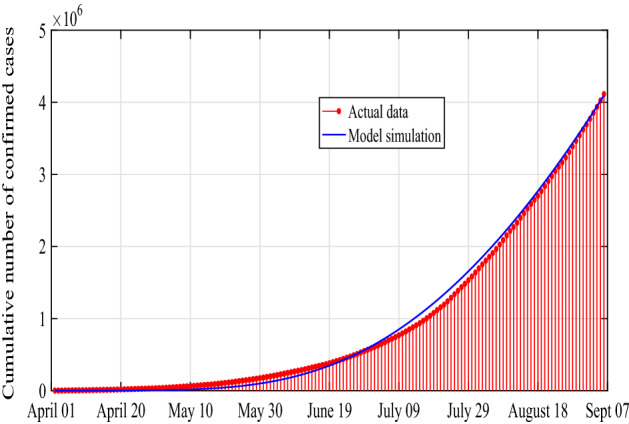
Plots of the output of the fitted model (1) and the observed active corona cases for India. Red dotted line shows real data points and the blue line stands for model solution. The figure shows that the cumulative number of COVID-19 increases exponentially as time progresses