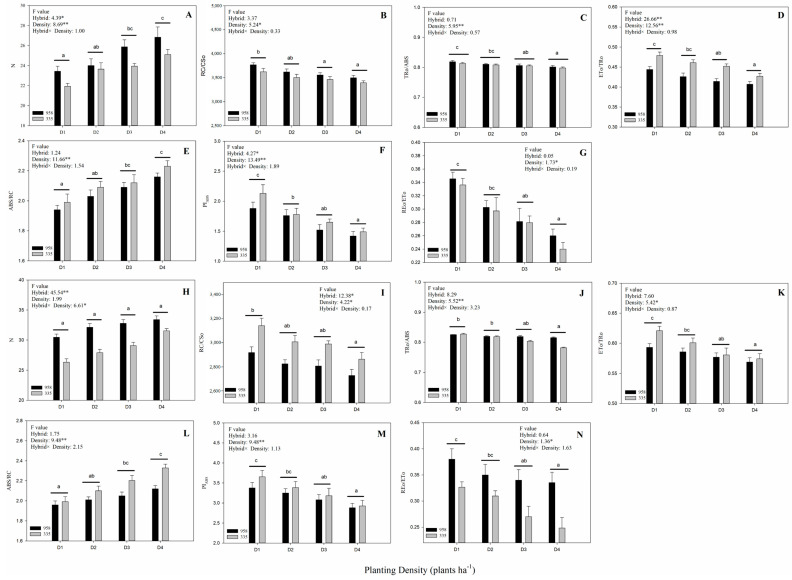
Figure 5.
Parameters derived from PF transients under different planting densities. (A–G): 2019 data and (H–N): 2020 data. (A,H): N, the number of QA reduction events. (B,I): RC/CSO, the density of photosystem II (PSII) RC per unit area. (C,J): TRO/ABS, the ratio of captured light energy to absorbed light energy. (D,K): ETO/TRO, the efficiency of electron transport at QA-. (E,L): ABS/RC, the light energy absorbed by the unit reaction center. (F,M): PIABS, performance index (potential) for energy conservation from photons absorbed by PSII to the reduction of intersystem electron acceptors. (G,N): REO/ETO, the efficiency of an electron beyond QA- reduced photosystem I (PSI) acceptors. Different letters (a, b, c) above the bars indicate significant differences between different planting densities at the 0.05 level. *, ** indicate significant differences at the 0.05 and 0.01 levels, respectively.

