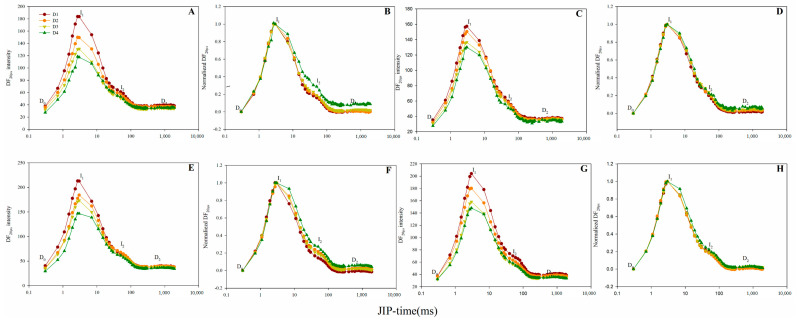
Figure 7.
Delayed chlorophyll a fluorescence (DF) induction kinetics of the two maize hybrids under different planting densities. (A–D): 2019 data and (E–H): 2020 data. (A,E): Absolute values of Zhengdan958. (B,F): Normalized values of Zhengdan958, expressed as (DFt − DO)/(DFI1 − DO). (C,G): Absolute values of Xianyu335. (D,H): Normalized values of Xianyu335, expressed as (DFt-DO)/(DFI1-DO). Signals are plotted on a logarithmic time scale. I1, I2, DO and D2 denote the 3 ms and 100 ms peaks, the initial minimum and final plateau, respectively.

