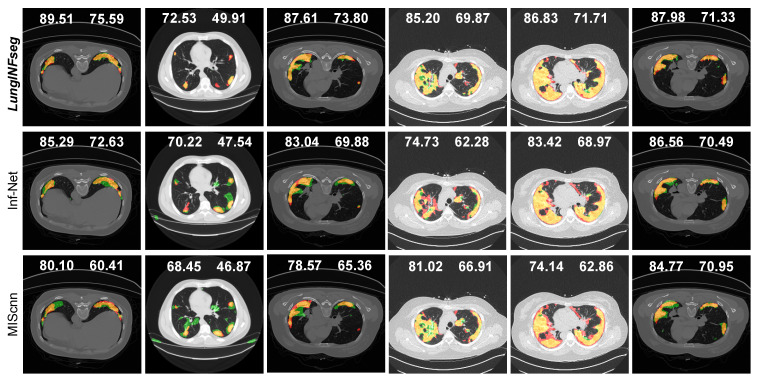
Figure 16.
Qualitative comparison of the segmentation results of the LungINFseg, Inf-Net, and MIScnn. Here, left and right side numbers on each example refer to dice and IoU scores, respectively. The colors are used to represent the segmentation results as follows: TP (orange), FP (green), FN (red), and TN (black).

