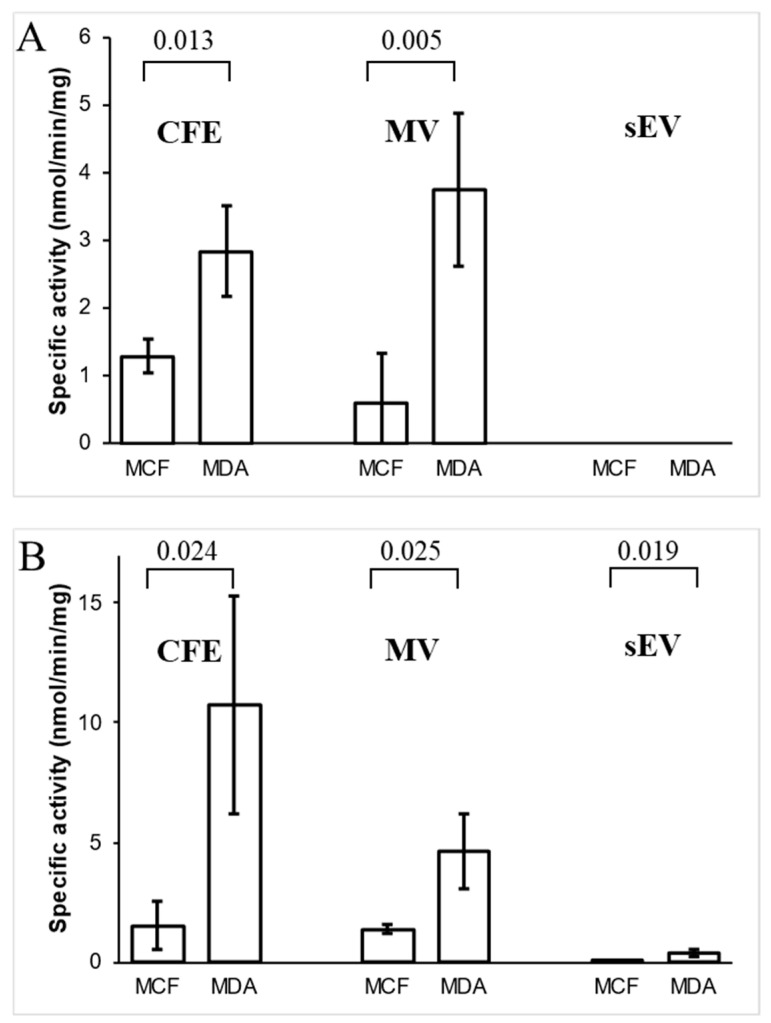
Figure 6.
Specific enzymatic activity of (A) ornithine aminotransferase (OAT) and (B) transaldolase (TALDO1) in cell-free extract (CFE) and their corresponding MV and sEV fractions. The bar graph represents mean values, while error bars indicate the standard deviation (SD) of four replicates, and p-values are indicated on the top.

