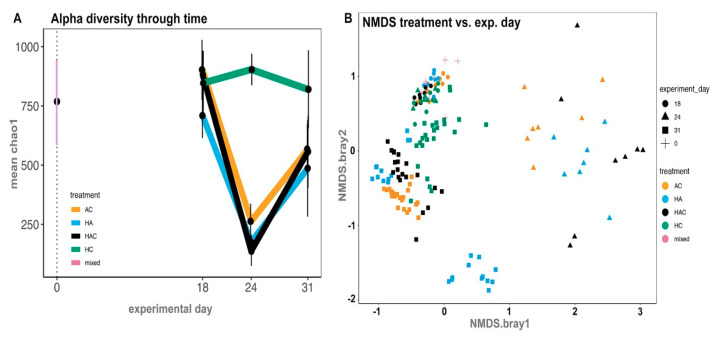
Figure 4.
Microbial analyses throughout the experiment in rat fecal samples—after colonization (Day 18), after antibiotic treatment (Day 24) and after colitis treatment (Day 31). (A) Changes in the alpha diversity in the groups throughout the experiment; (B) NMDS analyses of the compositional changes in gut microbiota throughout the experiment, comparing treatment (in color) versus experimental day (in shape). For more details about the experimental groups and treatments, see Figure 1 or Supplementary Data S1.

