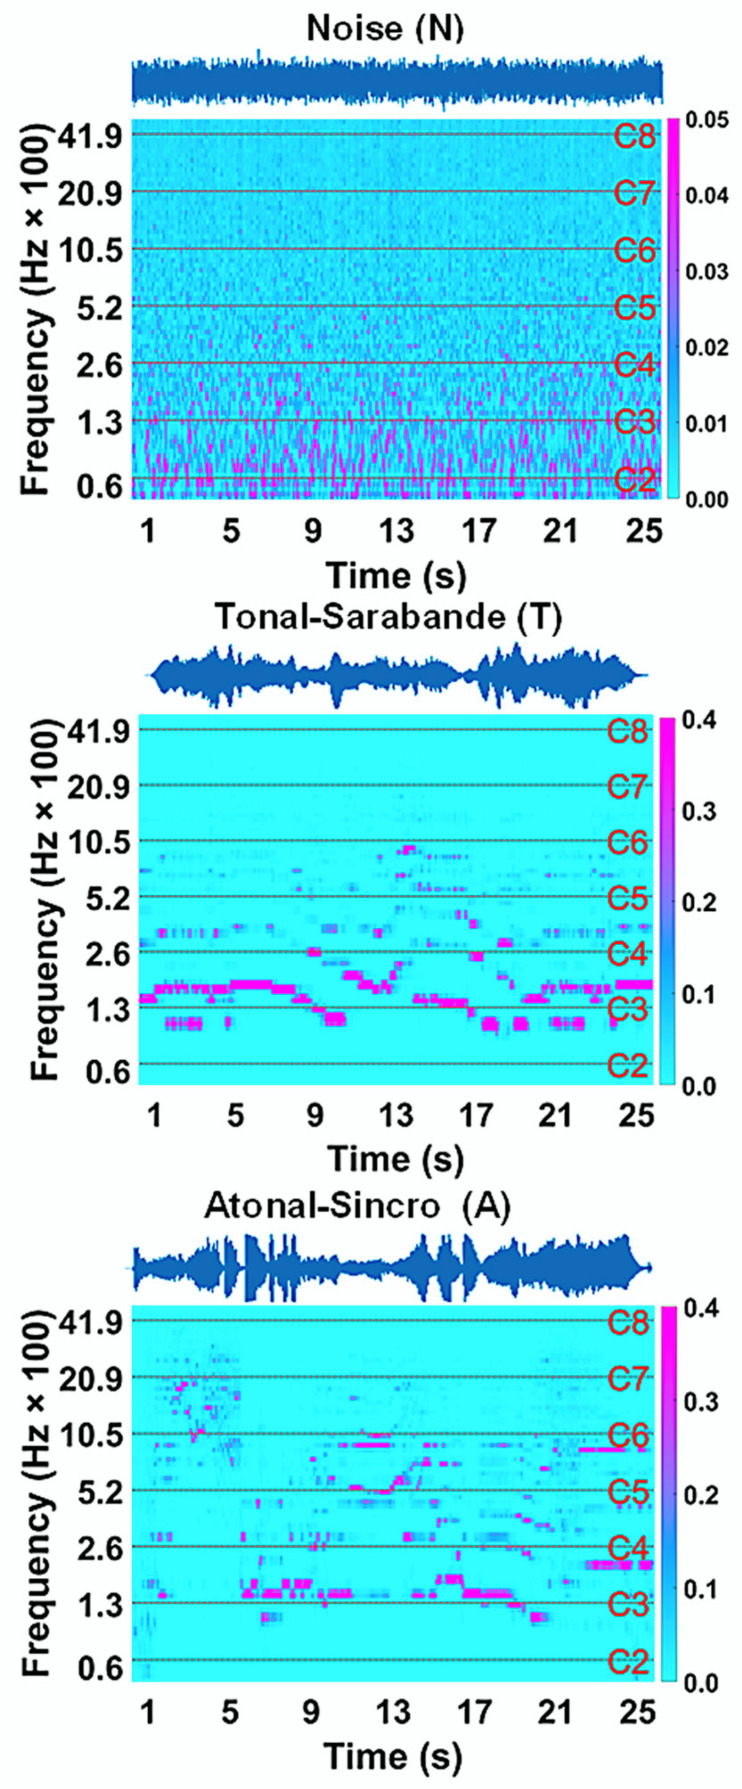
Figure 1.
From top to bottom are: the acoustic signal/stimulus and time-frequency spectrum of the pink noise (N), baroque tonal Sarabande excerpt (T) and, contemporary atonal music excerpt Sincro (A). The dashed line in the spectra delimits the successive octaves of the piano keyboard; for each octave, the frequency level of the musical note C is indicated on the right of the frequency axis. Time axes in seconds (s) for signals and spectra, and color bar (right side) in relative power units.

