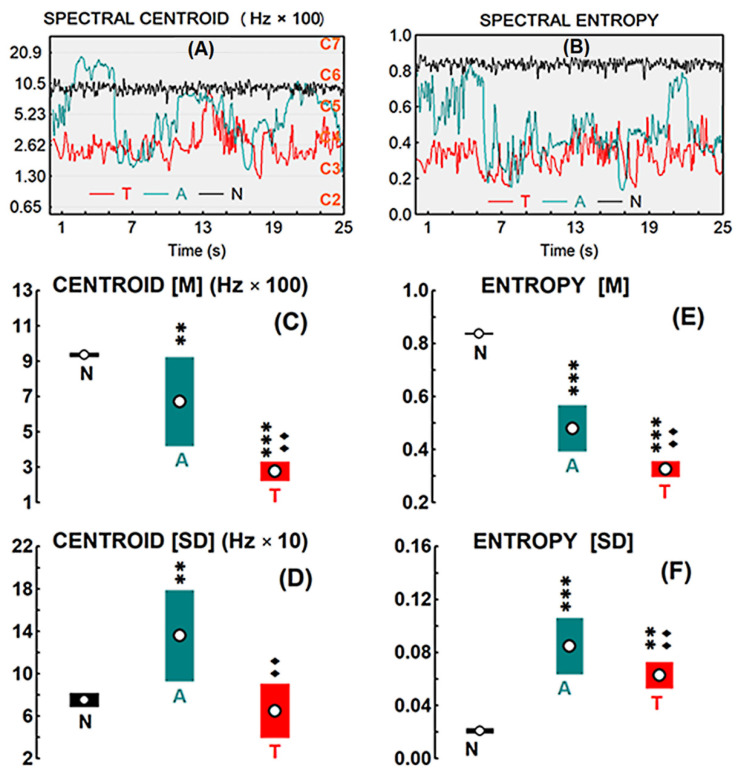
Figure 2.
(A) Time evolution of the spectral centroid of each signal-stimulus [N for noise, A for atonal, T for tonal]; the frequency of the different octaves (C2 to C7 on the right) is indicated on the left. (B) Time evolution of spectral entropy. (C) Spectral centroid mean [M] and (D) Spectral centroid variability [SD] throughout the stimulus time. (E) Spectral entropy mean [M] and (F) Spectral entropy variability [SD] throughout the stimulus time. Open circles indicate the means, and color ranges the 95% confidence interval. Statistical significance levels of the differences between T or A against N were indicated by asterisks: (**) when p < 0.01, and (***) when p < 0.001. The same levels, but in solid diamonds (♦), were used for T against A.

