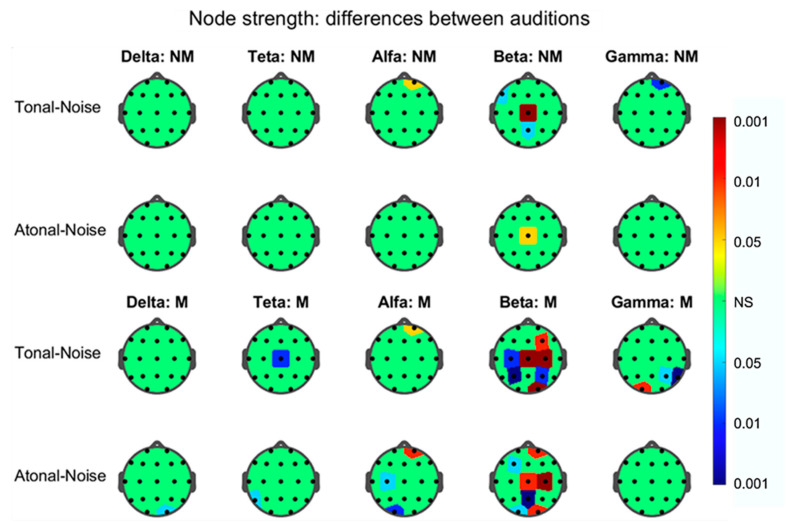
Figure 9.
Statistical significance values (P) of the difference of the node degree between tonal-noise and atonal-noise auditions (left column) for the different nodes of the five graphs of each EEG frequency band pointed out. The color of the area around each node corresponds to the significance level P indicated in the color-bar on the right (valid to all heads); the colors were associated with the three levels of significance (p < 0.001, p < 0.01, and p < 0.05) by using three range of reds when the difference was positive and three range of blues when it was negative. Nodes without statistical significance (NS) appear in green. In the upper two rows the values for non-musicians (NM) appear in the indicated frequency bands and in the lower two those corresponding for musicians (M) group.

