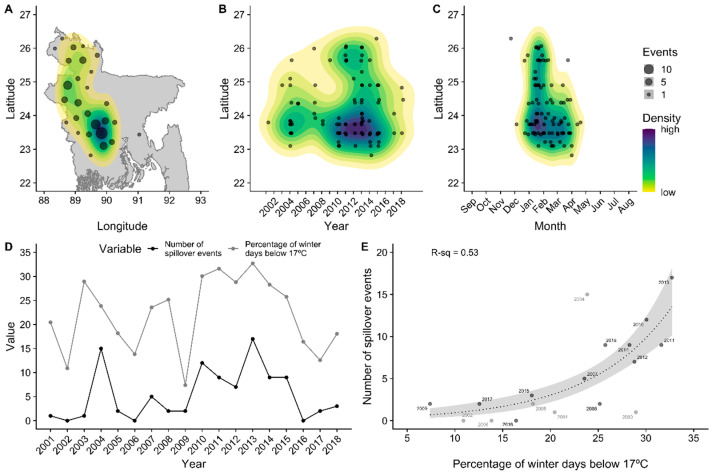
Figure 1.
Spatiotemporal patterns of Nipah virus spillover events across Bangladesh, 2001–2018. Color contours in panels (A–C) show the spatial density of events estimated with a bivariate normal kernel. Panels (D,E) show the variation in the number of Nipah spillover events across years and the association with cold winter temperatures. Gray dots in panel (E) show the years before systematic Nipah virus surveillance.

