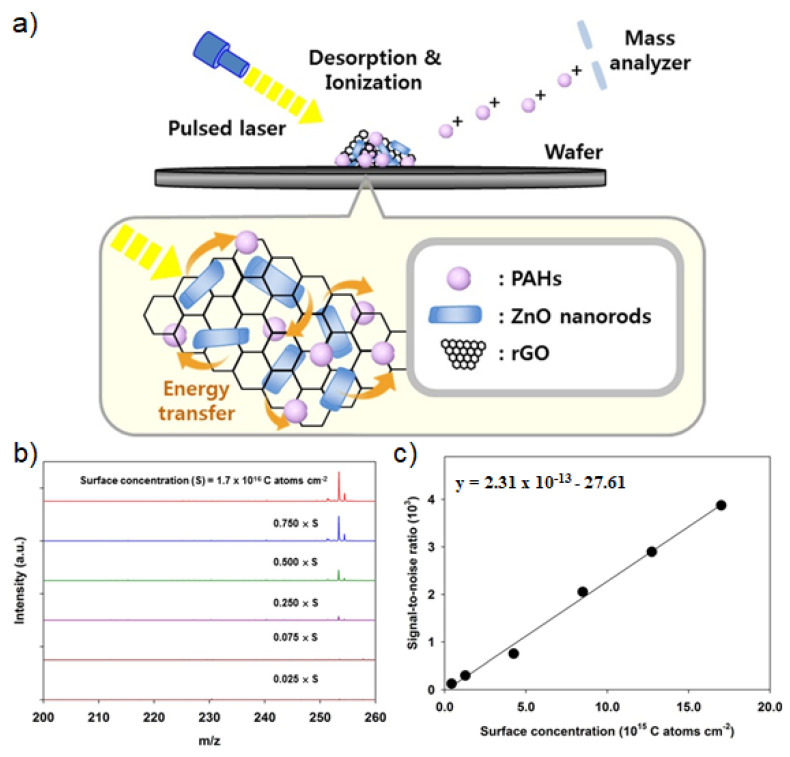
Figure 8.
(a) Schematic diagram of the structure and LDI-TOF-MS application of ZnO/RGO nanohybrid structures. (b) LDI-TOF-MS spectra and (c) standard concentration curve of B[a]P obtained with ZnO/RGO nanohybrid structures with different concentration. Adapted with permission from ref. [93]. Copyright (2018) Elsevier.

