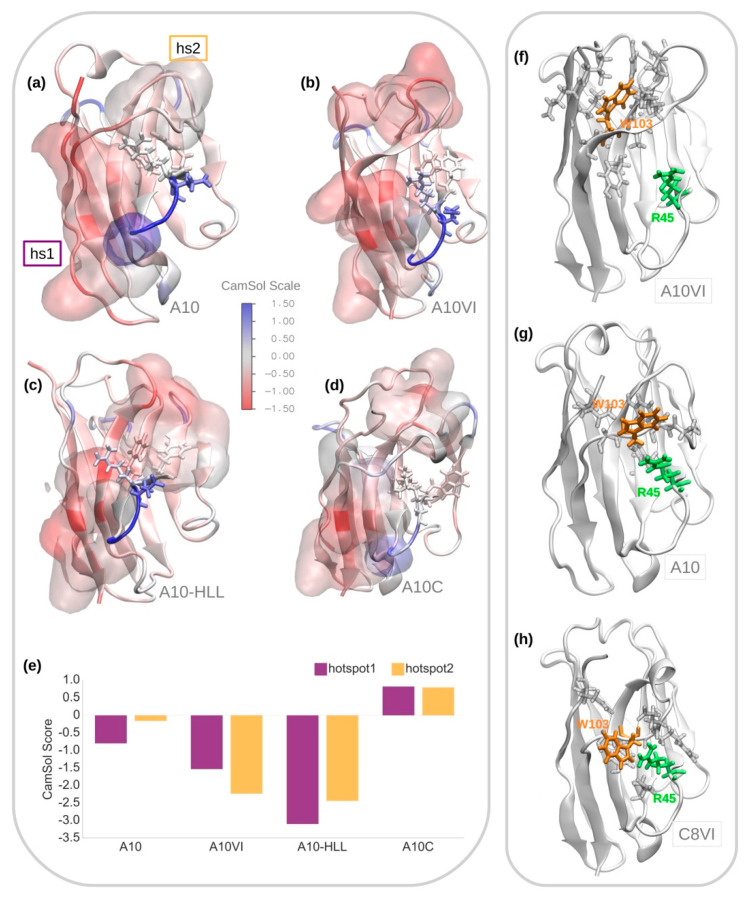
Figure 3.
Structural analysis of A10 and its mutants. Representative MD conformations of (a) A10, (b) A10VI, (c) A10-HLL and (d) A10C colored according to the solubility CamSol residue scores. Solubility hotspots are represented as surfaces while the FW2 hallmarks VGLW/FERF are showed in licorice. (e) Solubility CamSol scores of the two hotspots identified in the structures of all 4 VHHs. Lower scores values (higher degree of red in the scale) indicate regions with poor solubility or higher aggregation propensity. Structural comparison of the interaction between Trp103 (orange) and Arg45 (green) in the most representative conformations of (f) A10VI, (g) A10, and (h) C8VI. All residues located within a distance of 4 Å of Trp103 are also indicated.

