
Fig. 2.
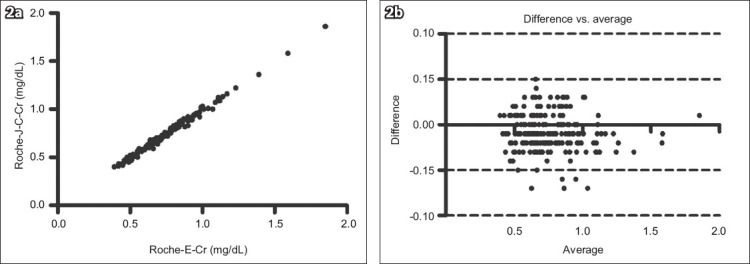
(a) Scatter graph shows the correlation between the Roche Cobas Integra 400 enzyme creatinine (Roche-E-Cr) and Roche compensated Jaffe creatinine (Roche-J-C-Cr) methods (n = 163, r2 = 0.9913, p < 0.0001). (b) Bland-Altman plot shows agreement between the two methods (bias = −0.08 ± 0.02).