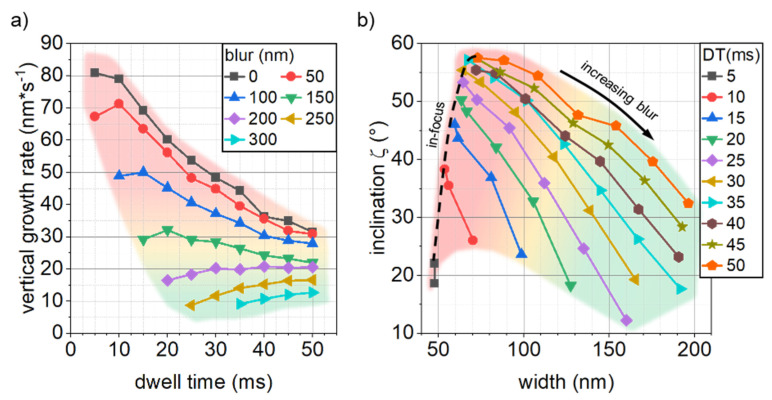
Figure 4.
(a) vertical growth rate vs. DT for different beam blurs. The graph illustrates the working regime shift from molecule limited regime (MLR) (in-focus, blur < 200 nm, shaded red) towards more electron limited regime (ELR) (blur > = 200 nm, shaded green) conditions for increasing blur values. (b) demonstrates the enhanced tunability. While the dashed line illustrates one-dimensional, intrinsic width/inclination behavior, the introduction of a beam blur significantly expands the addressable width/inclination range. The color shading follows the code in (a), where green indicates the most balanced range for highest stability and efficiency.

