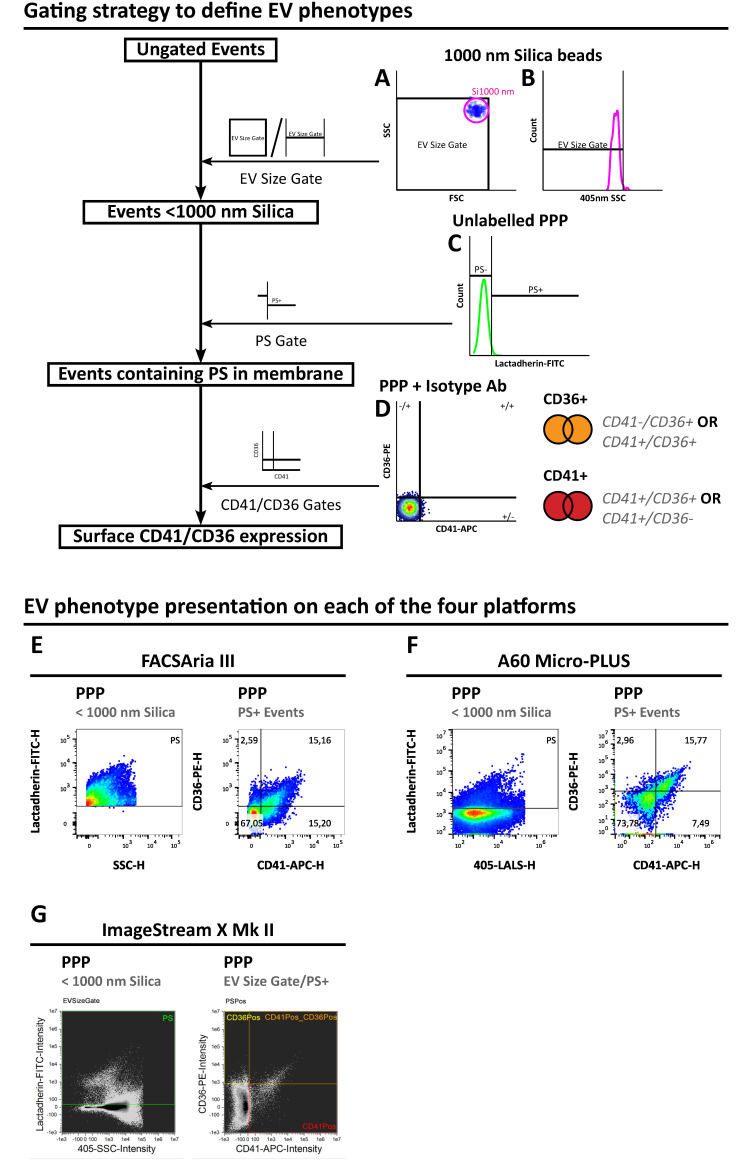
Figure 1.
EV-defining gating strategy and depiction of representative data for each of the three flow cytometry platforms. (A–D) Schematic depiction of the gating strategy used for defining EV phenotypes in PPP samples. (A) First, a size gate was established on the 99th percentile of green fluorescent 1000 nm silica nanospheres (RI 1.42) on FSC/SALS vs. SSC/LALS on FACS Aria III and Apogee A60 Micro-PLUS or (B) on 405 nm SSC alone on ImageStream X Mk II. (C) Next, on events within the EV size gate in an unlabelled PPP sample, a gate was established on the 99th percentile in the FITC channel to define lactadherin-binding phosphatidylserine (PS)+ events (Apogee A60 Micro-PLUS and ImageStream X Mk II) or set to the triggering threshold value of 200 (FACS Aria III). (D) On PS+ events in a PPP sample stained with isotype control antibodies, quadrant gates were established on the 99th percentiles of events in the APC vs PE channels to define different combinations of CD41+/− and CD36+/− events, respectively. (D) Finally, the sums of CD41+ and CD36+ events were defined by establishing logical OR gates on “CD41+|CD36+ OR CD41+|CD36−“ and “CD41−|CD36+ OR CD41+|CD36+”, respectively. (E–G) Representative histograms of PS+ events (left) or scatterplots of CD41+/−|CD36+/− events (right) for (E) FACS Aria III, (F) Apogee A60 Micro-PLUS and (G) ImageStream X Mk II. EV: Extracellular vesicle; PPP: Platelet poor plasma; PS: Phosphatidylserine; FITC: Fluorescein isothiocyanate; APC: Allophycocyanin; PE: Phycoerythrin; SSC: Side scatter; LALS: Large angle light scatter.

