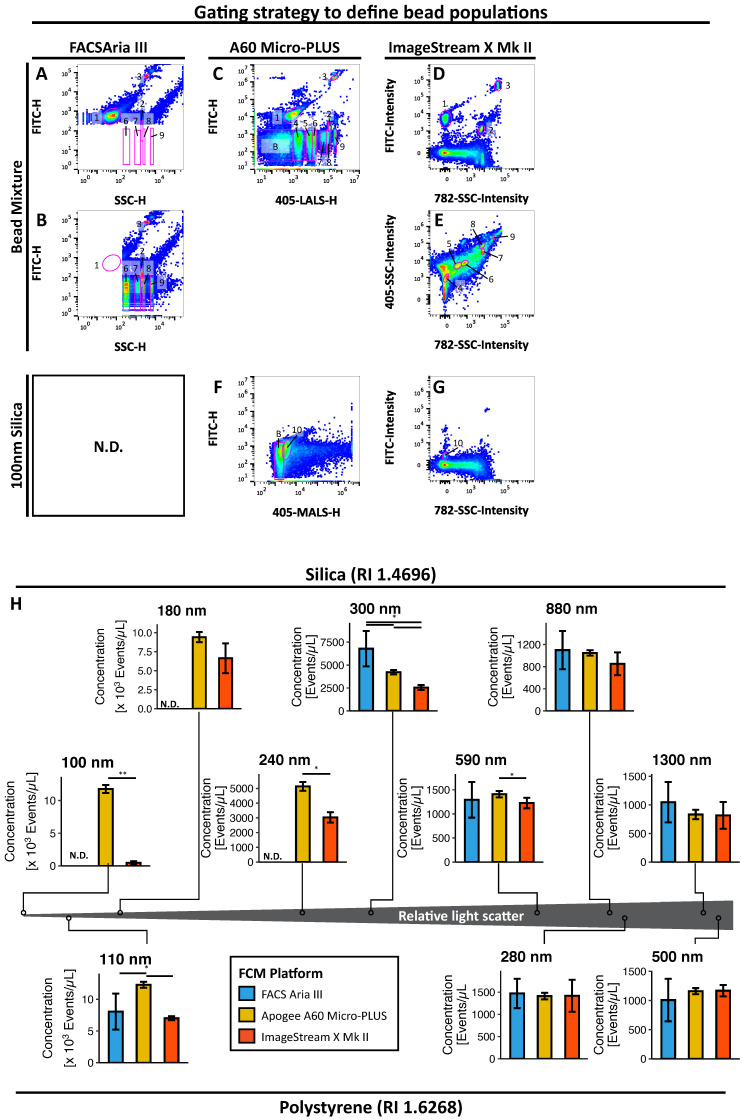
Figure 2.
Detection and quantification of nanospheres with different refractive indices. (A–G) Gating strategy to define each nanosphere population in the bead mixture on (A) FACS Aria III for triggering in the FITC and (B) SSC, (C) Apogee A60 Micro-PLUS and (D,E) ImageStream X Mk II. (F,G) Gating strategy to define dimly FITC fluorescent 100 nm silica nanospheres on (F) Apogee A60 Micro-PLUS and (G) ImageStream X Mk II. (H) Concentrations of silica (top) and fluorescent polystyrene (bottom) nanosphere populations measured by each of the four platforms with an indication to their relative light scatter. Results are depicted as mean (bar) ± 1SD (error bars) for n = 5 observations of each nanosphere population acquired over the course of five analysis days. Numbers in A-E represent different nanosphere populations as follows: 1: Ps110 nm; 2: Ps280 nm; 3: Ps580 nm; 4: Si180 nm; 5: Si240 nm; 6: Si300 nm; 7: Si590 nm; 8: Si880 nm; 9: Si1300 nm; 10: Si100 nm; B: Background. *: p < 0.05; **: p < 0.01. N.D.: Not detected; RI: Refractive Index; MALS: Medium angle light scatter.

