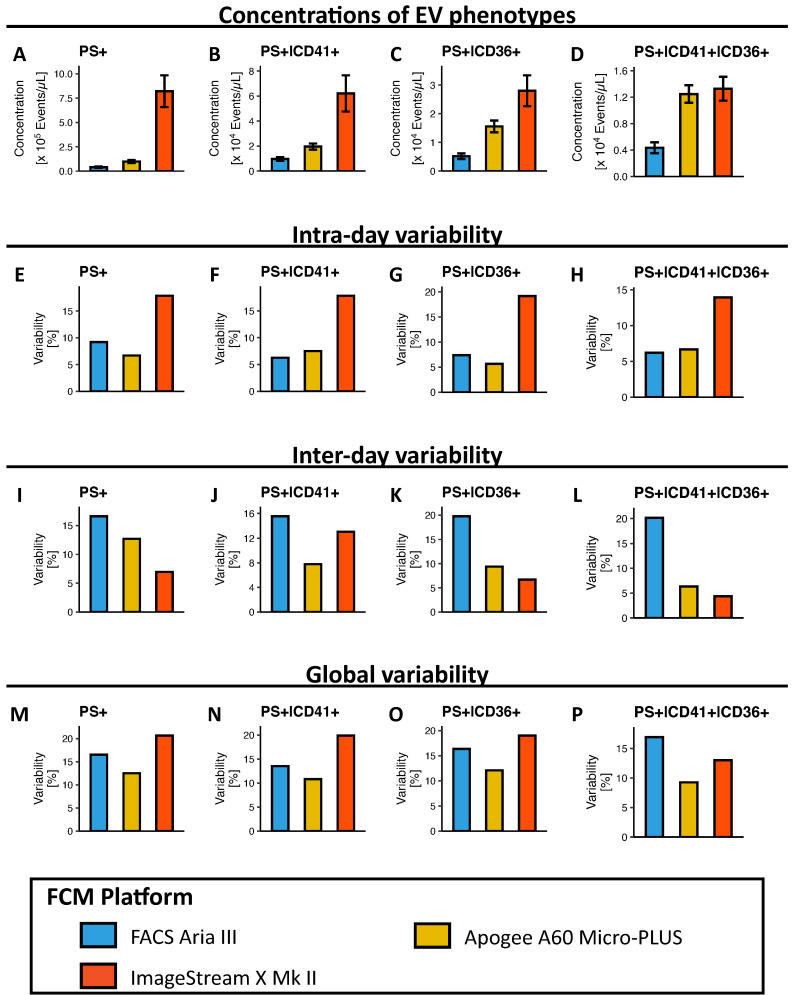
Figure 4.
Concentrations and variability in the detection of EV phenotypes on three different flow cytometry platforms. (A–D) Concentrations of (A) PS+, (B) PS+|CD41+, (C) PS+|CD36+ and (D) PS+|CD41+|CD36+ EVs detected on the three different platforms. Results are depicted as mean (bar) ± 1SD (error bars) of concentrations from the inter-day variability study. (E–H) Intra-day variability in the detection of (E) PS+, (F) PS+|CD41+, (G) PS+|CD36+ and (H) PS+|CD41+|CD36+ EVs (n = 20 per platform). (I–L) Inter-day variability in the detection of (I) PS+, (J) PS+|CD41+, (K) PS+|CD36+ and (L) PS+|CD41+|CD36+ EVs (n = 5 × 5 per platform). (M–P) Global variability in the detection of (M) PS+, (N) PS+|CD41+, (O) PS+|CD36+ and (P) PS+|CD41+|CD36+ EVs (n = 40 per platform). Coefficients of variability (CV) were calculated as SD/mean expressed in percent.

