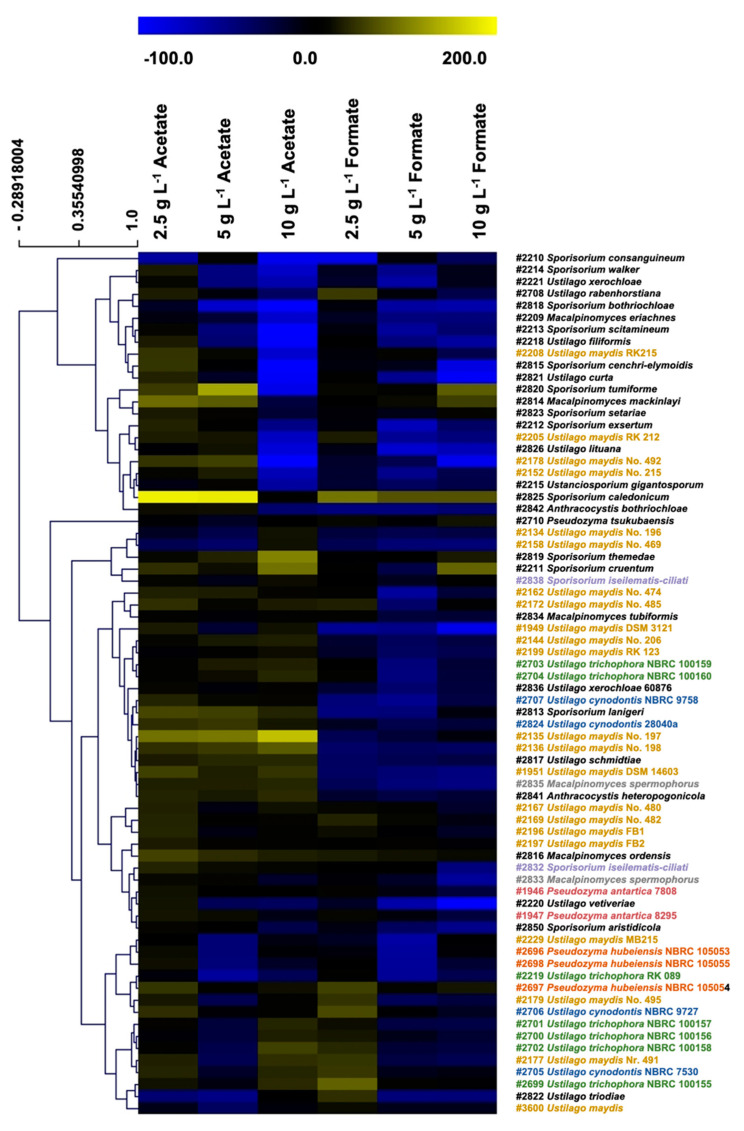
Figure 2.
Overview of biodiversity screening results. Hierarchical cluster analysis (HCA) heatmap showing whole set growth screening results obtained during 24-deep-well plate cultivation in MTM medium with 4 g L−1 NH4Cl using the Growth Profiler system by EnzyScreen. Strains were cultivated for growth on both co-substrates under various conditions of 2.5, 5.0, and 10.0 g L−1 in combination with 20.0 g L−1 glucose. Maximum optical density (OD600) was normalized to the growth of the respective glucose reference and visualized via color scales in the HCA heatmap indicating relative growth [%] Blue color indicates a lower growth, black a comparable growth behavior, and yellow a higher growth compared to the respective glucose reference. Strains belonging to one species were colored accordingly in the displayed rows. Experiments were performed with two biological duplicates. Raw data are provided in Supplementary Materials (Tables S2 and S3).

