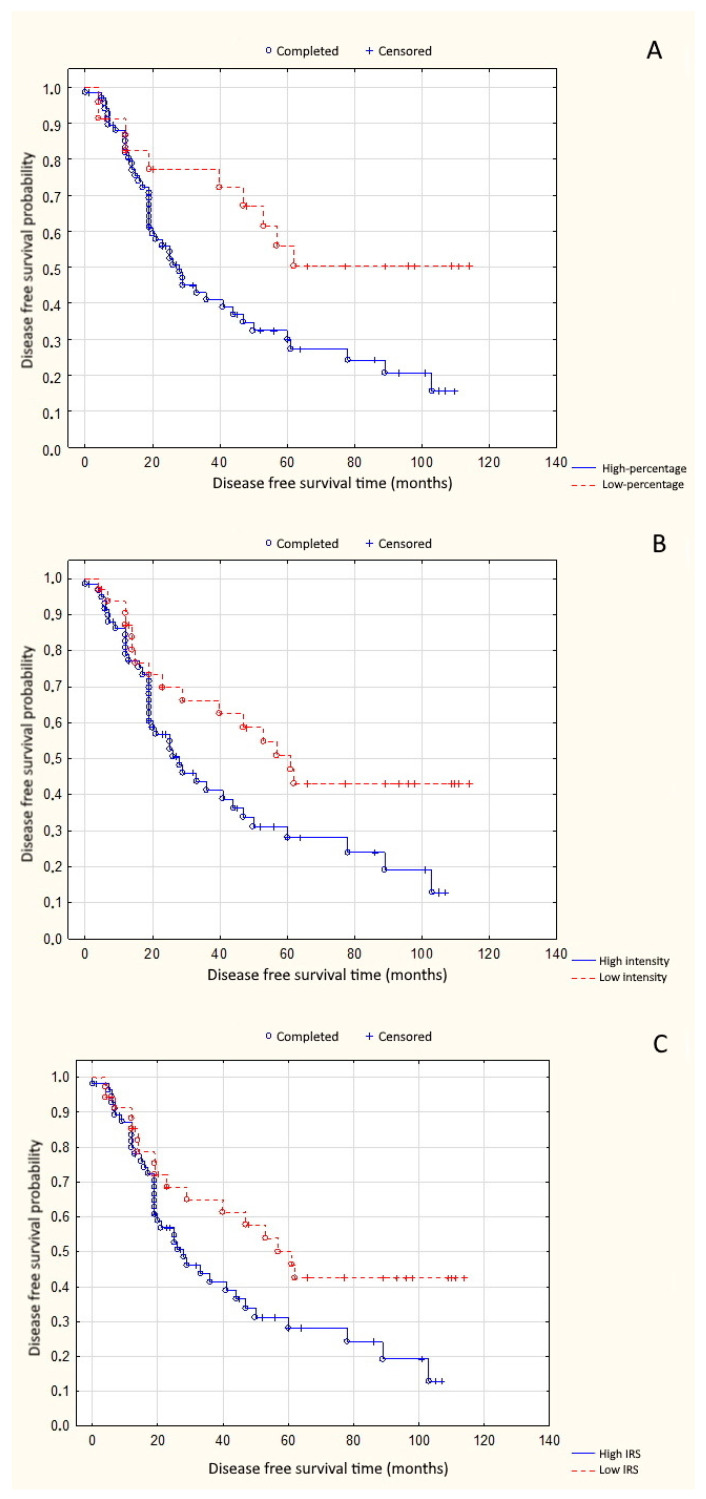
Figure 3.
(A) Correlation between PARP-1 percentage of positive cells and disease-free survival time (p = 0.012); (B) correlation between PARP-1 reaction intensity and disease-free survival time (p = 0.028); and (C) correlation between PARP-1 total expression and disease-free survival time (p = 0.039).

