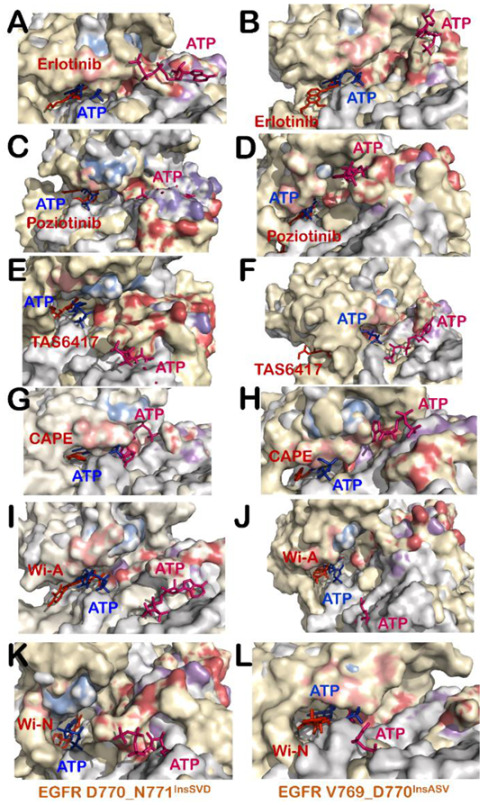
Figure 3.

Superimposition of wildtype EGFR–ATP (grey-blue) complex with D770_N771InsSVD-inhibitor–ATP (yellow-red-pink) complexes (A,C,E,G,I,K) and V769_D770InsASV-inhibitor–ATP (yellow-red-pink) complexes (B,D,F,H,J,L) showing interaction of ATP and inhibitors at the ATP binding site: erlotinib (A,B); poziotinib (C,D); TAS6417 (E,F); CAPE (G,H); Wi-A (I,J); and Wi-N (K,L). P Loop and activation segment of wildtype EGFR–ATP complex is shown in marine blue and purple color and that of EGFR exon 20 insertion mutant–inhibitors–ATP complexes is shown in salmon and firebrick red color.
