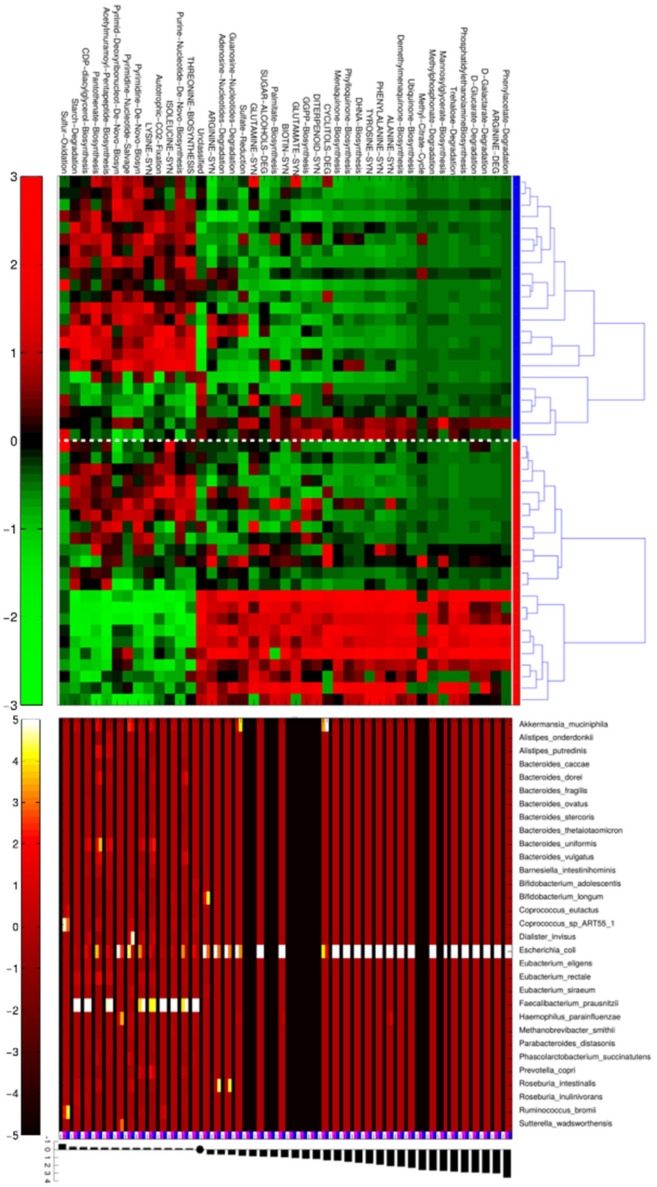
Figure 3.
Metagenomic pathways and bacterial genera more expressed with +IMT/+SCA. Heatmap on top shows the MetaCyc L4-pathways statistically different between +IMT/+SCA (n = 23, red bars at right) and −IMT/−SCA (n = 23, blue bar at right) individuals. Normalized and scaled read counts (CPM) per pathway are standardized along rows. Within each experimental group, samples are clustered for similarity using Pearson’s correlation metric and average linkage; the plot in the middle represents the relative contribution of bacterial species to each differential pathway. Values are average CPM calculated for −IMT/−SCA samples (indicated by the blue square below) and +IMT/+SCA (indicated by the magenta square below). Average CPM values are standardized on a per-column basis (i.e., on pathways), in order to highlight, for each pathway which bacterial taxa contributes most. On the bottom, of the figure, the barplot indicates log2 fold-change between +IMT/+SCA and −IMT/−SCA average CPM.

