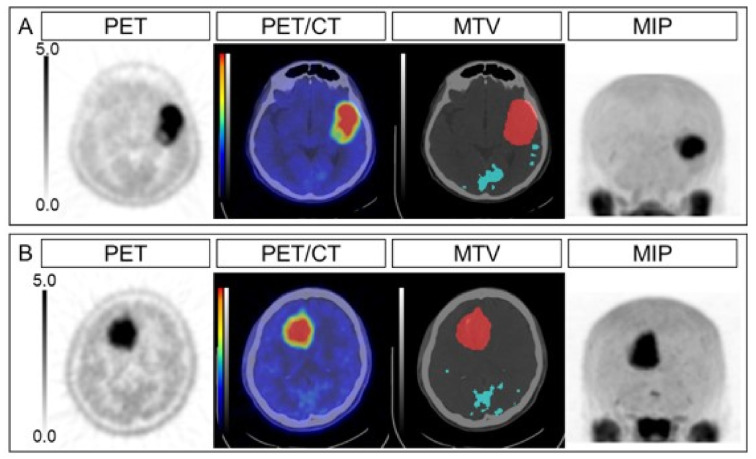
Figure 1.
Representative cases. The PET, PET/CT, MTV, and MIP images are shown for an anaplastic astrocytoma case (A) and an anaplastic oligodendroglioma case (B). The SUVmax values were 7.34 and 6.87, the TNRs were 4.89 and 4.79, the MTVs were 52.7 mL and 56.3 mL, the TLMUs were 170.1 and 229.8, the LGREs were 0.118 and 0.054, and the correlations were 1.27 and 0.89, respectively, for cases (A) and (B). The overall survival intervals were 4.5 months (dead) and 31.6 months (surviving). PET, positron emission tomography; MTV, metabolic tumor volume; MIP, maximum intensity projection; SUVmax, maximum standardized uptake value; TNR, tumor-to-normal ratio; TLMU, total legion methionine uptake; LGRE, low gray-level run emphasis.

