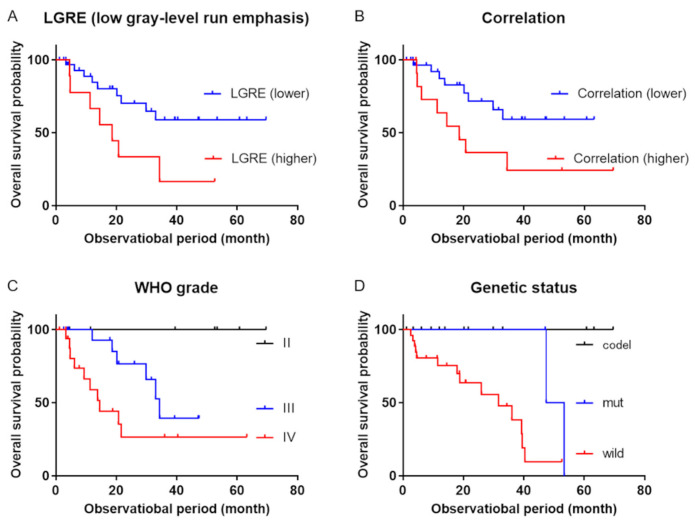
Figure 2.
Kaplan–Meier survival curves. Kaplan–Meier survival curves revealed significant differences in overall survival between (A) patients with low gray-level run emphasis (LGRE) of <0.088 (blue line) and >0.088 (red line) (p = 0.022), (B) patients with correlation values of <1.074 (blue line) and >1.074 (red line), (C) patients with the different WHO grades (black line = grade II, blue line = grade III, red line = grade IV; p = 0.0066), and (D) patients with the different genetic statuses (black line = IDH mutant with 1p/19q-codeleted, blue line = IDH mutant without 1p/19q-codeleted, red line = IDH wild-type without 1p/19q-codeleted, p = 0.0004). WHO: World Health Organization; IDH: isocitrate dehydrogenase.

