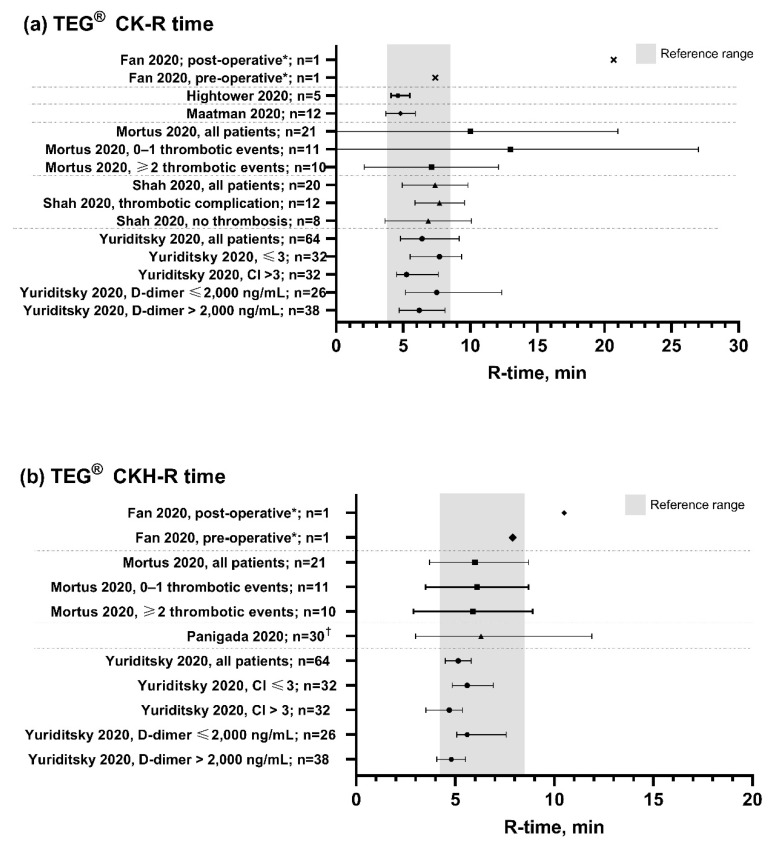
Figure 4.
TEG R-time values observed in patients with COVID-19. Grey bars show the normal TEG reference range [10]. CK, citrated kaolin assay; CKH, CK with heparinase assay; R-time, reaction time. * TEG measurements recorded before and after endovascular stent graft exclusion of the aortic thrombus and right lower limb embolectomy following diagnosis of acute ischemic limb. † Measurements were repeated on two consecutive days in six patients. Data points are mean with standard deviation error bars for normally distributed data, or median with interquartile range error bars for data that were not normally distributed. Dotted lines separate different studies with different patient populations. Data are not directly comparable between studies.

