Figure 3.
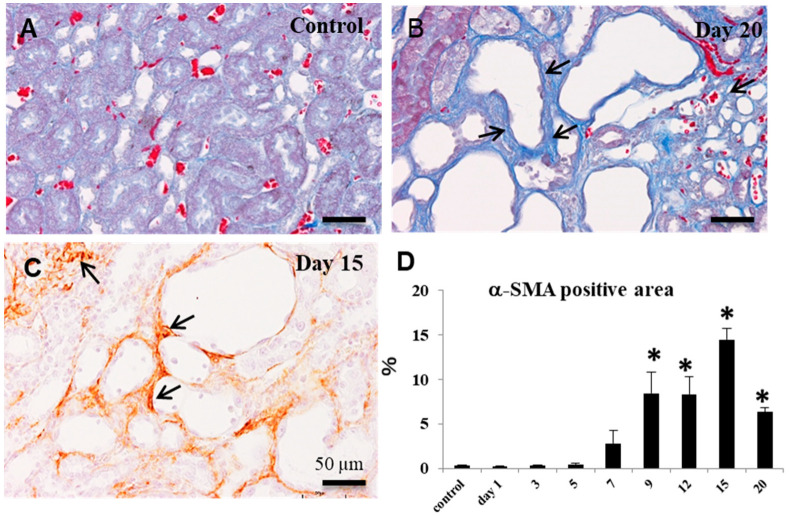
Evaluation of interstitial fibrosis of CDDP-induced rat renal lesions. (A) The azan–Mallory stain; in the control kidneys, collagen fibers are not seen in the interstitium (fibrosis degree, −). (B) The azan–Mallory stain; on day 20, severe fibrosis (fibrosis degree, 4+) (arrows) is seen in the interstitium. (C) Immunohistochemistry for α-smooth muscle action (α-SMA); α-SMA-positive myofibroblasts are seen in the increased fibrosis (fibrosis degree, 4+) (arrows). Bar = 50 µm. (D) The percentage of α-SMA-positive area in the control and CDDP-injected rats on days 1 to 20; Dunnett’s test, *, significantly different from controls at p < 0.05.

