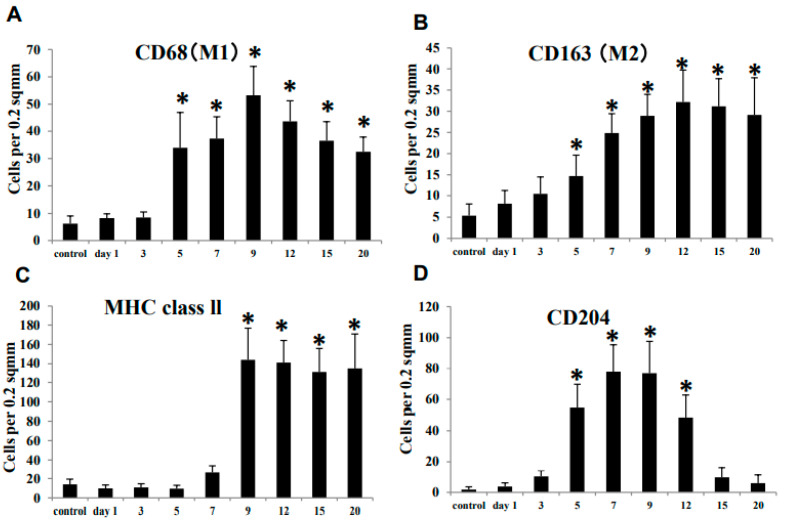
Figure 4.
The number of macrophages reacting to CD68 (A, for M1), CD163 (B, for M2), MHC class II (C), and CD204 (D) in the control and CDDP-treated kidney on days 1–20. Note that the kinetics of these macrophages in comparison to controls differ from each other. Dunnett’s test, *, significantly different from controls at p < 0.05.

