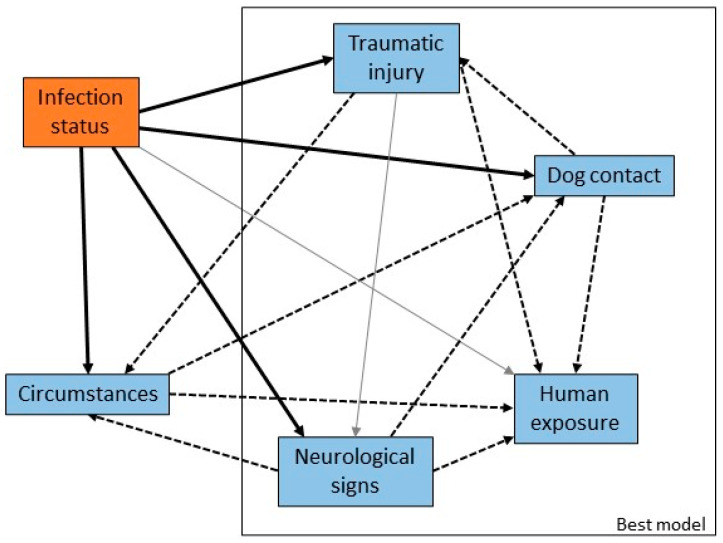
Figure 4.
Causal web of association between presentation or clinical signs and ABLV infection status. Heavy black arrows are significant univariable associations between the presentation or clinical sign and infection status, dotted arrows are significant associations between pairs of variables, and grey arrows are plausible causal associations that were not statistically significant in our dataset. The rectangle encloses the suite of variables that produced the best multivariable model.

