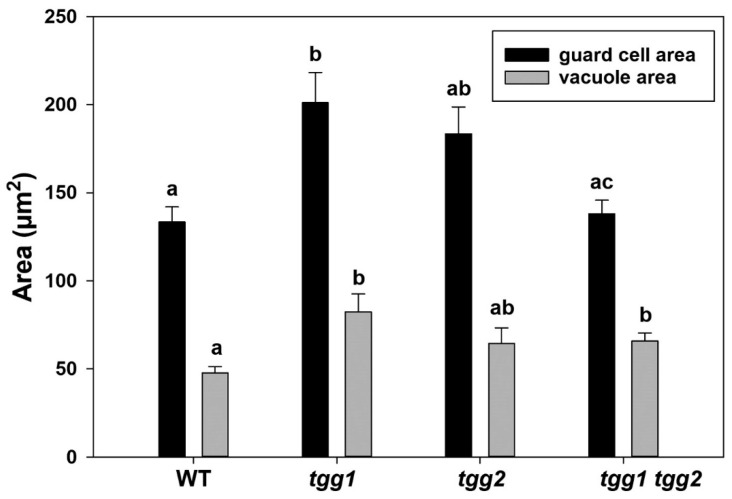
Figure 6.
Area of GCs and vacuoles from transmission electron micrographs of rosette leaves of WT, tgg1, tgg2 single, and tgg1 tgg2 double mutants of Arabidopsis. Bars represent the means ± SE (WT: n = 12), (tgg1: n = 15), (tgg2: n = 15), and tgg1 tgg2 (n = 18). Different letters (a, b and c) above the bars indicate significant differences in guard cell area and vacuole area between WT, tgg1, tgg2, and tgg1 tgg2 as determined by a Kruskal-Wallis test followed by a Dunn’s method for pairwise comparisons (p < 0.05).

