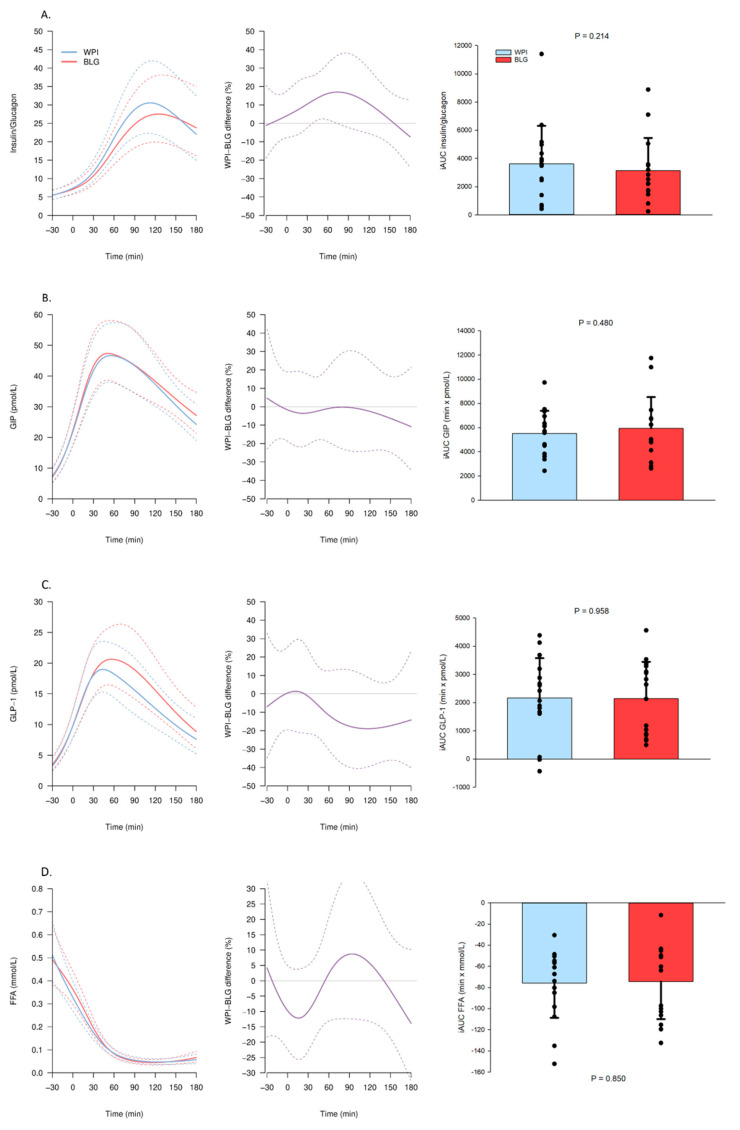
Figure 4.
Plasma (p) and serum (s) concentrations of hormones and substrates after β-lactoglobulin (BLG) and whey protein isolate (WPI) pre-meals 30 min before an OGTT (0 min). Panels to the left show trajectories of the mean concentration (solid lines) with 95% confidence intervals (95% CIs) (dashed lines) of (A) s-insulin/p-glucagon ratio, (B) p-glucose-dependent insulinotropic polypeptide (GIP), (C) p-glucagon-like peptide-1 (GLP-1), (D) s-free fatty acids (FFA) after WPI (blue) and BLG (red) consumption. The mean relative difference (solid line, purple) with 95% CIs (dashed lines) between the two interventions is shown in the middle panels. Panels to the right show the individual incremental area under the curve (iAUC) with a bar plot showing the mean ± standard deviation after WPI (blue) and BLG (red) consumption. n = 16.

