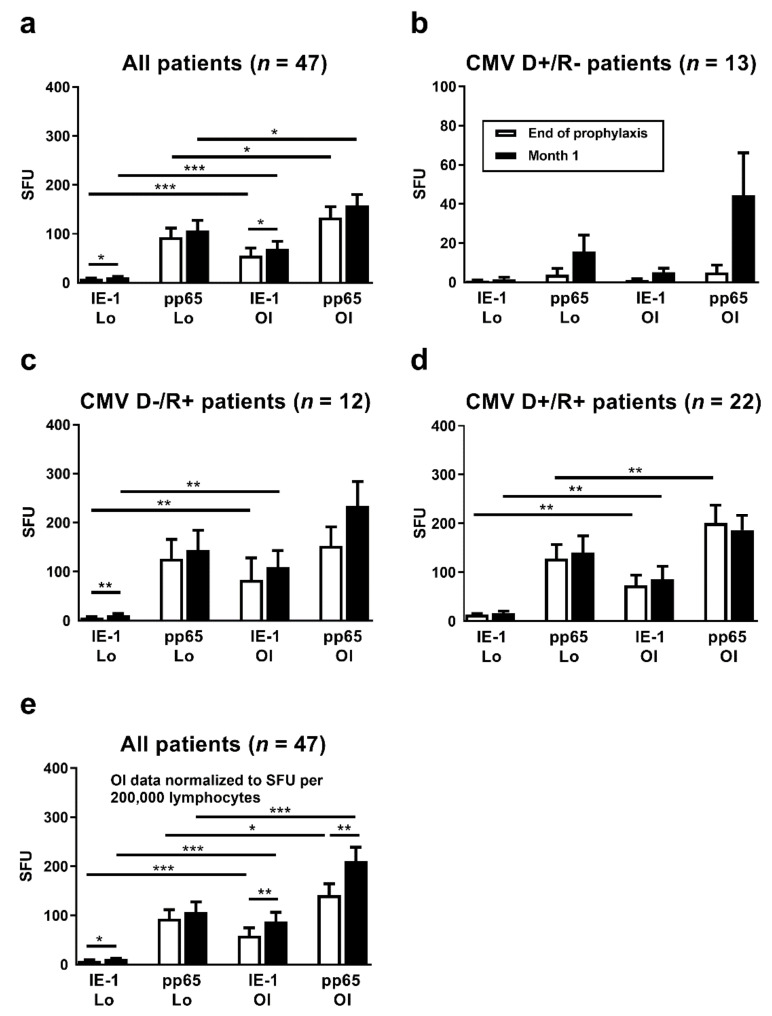
Figure 2.
Comparison of CMV-specific ELISpot responses at the end of antiviral prophylaxis (white bars) and at month 1 thereafter (black bars). Results of the T-Track CMV (Lophius Biosciences, Lo) and of the T-SPOT.CMV (Oxford Immunotec, OI) in liver transplant recipients are shown as spot forming units (SFU) per 200,000 lymphocytes (T-Track CMV) and per 250,000 PBMC (T-SPOT.CMV) in panel (a–d). To allow a better comparison of the strength of reactions, results of the T-SPOT.CMV were further normalized to lymphocyte numbers and given as SFU per 200,000 lymphocytes, as shown in panel (e). Results were only considered if datasets for both ELISpot assays at the end of prophylaxis and at month 1 were available (47 out of 56 patients). Panel (a) and (e) show data on all liver transplant recipients (n = 47), panel (b–d) on patients with various combinations of CMV IgG in donors (D) and recipients (R). Please note the different scale on the y axis in panel (b). Mean and standard of the mean (SEM) are indicated. Data were compared by Wilcoxon matched pairs test (* p < 0.05, ** p < 0.01, *** p < 0.001).

